Latest Study
From 82% to 95% on Existing Hardware — Assessing and Improving an On-Premise AI Assistant
An AI assistant had been built competently but could not be made trustworthy: 82% answer accuracy, zero answers safe to auto-accept, and a ban on third-party API LLMs. This is the study report of the engagement that followed — to a deployed 94.8% accuracy and a new zero-critical-error auto-accept capability, on the same single GPU.
Part I tells the story in plain language for decision-makers; Part II carries the technical and governance detail for reviewers.
At a Glance
- Answer accuracy moved from 82.2% to 94.8% on the deployed build (95.0% at the peak validated configuration), on the same single GPU. No new hardware. The before/after was measured on the same 200-question blind set with the same scorer that produced the baseline; the deployed build’s figure was read at acceptance on the expanded test set.
- A zero-critical-error auto-accept capability that did not exist before: in the first production month, roughly 1,100 answers were auto-accepted on traffic with zero critical errors.
- Answers in seconds instead of half a minute: a production median of about three and a half seconds end-to-end, with the model’s own answer time around a second and a half, against a baseline that averaged about 20 seconds. Fast enough for a specialist to use on a live call.
- All three decision gates cleared: two “go with conditions,” then a final acceptance at nineteen of twenty criteria, with the one remaining criterion deferred to the window it had to be measured in.
- Nine of nine pre-registered predictions held: each registered in writing before any pilot data existed, and scored at the gates pass-or-fail regardless of outcome.
- A clean compliance surface at go-live: zero access violations across 4,000 harness queries, answer redaction at 99.7% measured recall, and a disaster-recovery cutover drilled at 2 hours 48 minutes against a four-business-hour objective.
- On budget and on the committed date: engagement closed at its original three-phase envelope plus one scoped change order.
- A measured ~26% reduction in time per benefit lookup: inside the committed band.
How rigor was established: one blind evaluation set of 200 questions (180 answerable, 20 adversarial) built from call patterns; the same set and the same automated scorer before and after every change; predictions registered before data existed; and a standing option to pause or exit at every gate.
The Problem
Front-line specialists routinely answer questions concerning coverage, cost-sharing, provider participation, eligibility, and other plan-specific provisions in a regulated benefits-administration environment. Answering these questions often requires searching across lengthy and heterogeneous plan documents. Routine inquiries may be resolved quickly, while more complex questions can require substantially more time to locate, interpret, and verify.
At sufficient volume, document lookup becomes an operational constraint. Search time limits service capacity, particularly during periods of elevated demand, and increases the amount of specialized knowledge required of individual staff members. New specialists must learn both the underlying benefit concepts and the location, structure, and terminology of the relevant source materials.
Generative AI presents a potential way to reduce this search burden, but the use case imposes significant accuracy, privacy, and governance requirements. A plausible but incorrect answer may lead to an inaccurate explanation of benefits. The inclusion of protected or sensitive information also limits where data may be processed and which external services may be used.
A suitable system must therefore satisfy several requirements:
- Sensitive information must remain within an approved processing environment.
- Responses must be grounded in authorized source documents.
- Existing document-level access controls must be preserved.
- System activity must be logged and auditable.
- Answers must include citations that support efficient human verification.
- Uncertainty and insufficient evidence must be communicated clearly.
- The system must assist human decision-making rather than operate as an unreviewed authority.
The system architecture considered in this report is a retrieval-augmented assistant integrated into an enterprise communication environment. A user submits a question in natural language and receives a concise response supported by a citation and a link to the relevant source material. Additional features may include confidence indicators and a mechanism for reporting incorrect, incomplete, or unsupported responses.
The central technical issue is retrieval quality. A system may generate clear, source-faithful language and still produce an incorrect answer when the wrong document, provision, table, or plan variation is supplied to the language model. In this setting, answer quality depends first on identifying the correct governing evidence.
This distinction is operationally important. When retrieval performance is insufficient, users must independently locate and verify the source for every response. The assistant then adds a review step without consistently reducing the original document-search effort. Strong security controls, low hallucination rates, and well-formed citations are necessary, but they do not by themselves establish practical usefulness.
The problem addressed in this report is therefore whether a secure, access-controlled retrieval system can identify the correct plan-specific evidence with sufficient consistency to reduce lookup effort while maintaining the level of human verification required in a regulated environment.
Success is defined not only by technical performance, but also by measurable workflow improvement. The system must reduce the time or effort required to reach a supported answer without weakening privacy protections, access controls, auditability, or professional oversight.
Why This Kind of Engagement Matters
An organization in this position is usually advised to replace things: a bigger model, a bigger GPU, a different vendor, a fresh platform. Each is expensive, each is plausible, and, as this engagement measured directly, each can be completely wrong. An assessment-first engagement inverts the order: reproduce the system’s performance, find where the failure actually lives, test the obvious fixes cheaply enough to discard them, and only then spend improvement budget on the mechanism the evidence points to.
The deeper problem is trust. Specialists who catch a tool being confidently wrong leave quietly and do not come back. A system that is right 82% of the time but cannot tell you which answers to trust is, operationally, a system you must verify 100% of the time. Closing that gap takes more than a better score. It takes a tool that cites its sources, declines to guess, and earns back the people it lost.
Decision gates are how a buyer protects itself while that happens: exit options at fixed points, so continuing is always an explicit decision. You know it at the first gate, not at go-live.
Pre-registered predictions are the other half of the protection. A consultant writes down, before the data exists, exactly what each phase will deliver, and is then scored on it at the gate regardless of outcome — giving a client a way to interpret and understand what the results mean for each phase.
The Engagement Model
The engagement ran as RCTK’s assessment-and-improvement shape: a two-week assessment of the existing system, an eight-week improvement pilot, and a twelve-week productionization phase, each ending at a decision gate to proceed, pause, or exit for the work performed to date with no termination fee. Nothing about the later phases was owed until the earlier gate cleared.
A functioning system with a measurable baseline already existed, so the engagement assessed and improved it instead of rebuilding from scratch. The fallback was written into the plan, and if the assessment found gaps too large to close before the deadline, the engagement would close cleanly as an audit.
The operating discipline throughout was honest calibration: commit only what the evidence in hand supports, and label everything else a stretch. Predictions lived in two tiers, committed (a miss is a serious, reportable event) and stretch (a miss is informational), and a number moved from stretch to committed only when its specific gating evidence arrived.
Phase 1 — Reproduce, Then Diagnose
The assessment began by reproducing the numbers on the existing system, with the same 200-question blind set and the same scorer. It landed on 82.2% answerable accuracy, matching the reported figure exactly.
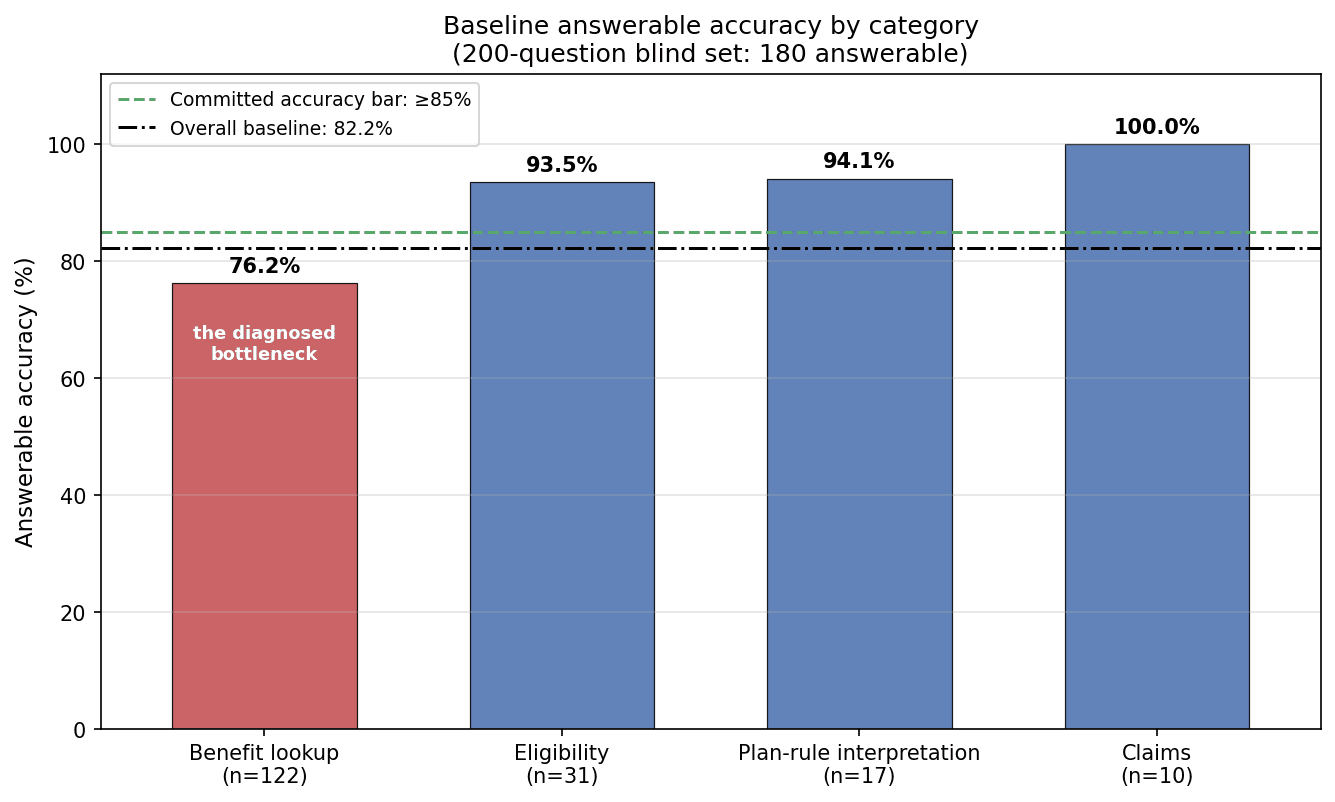
The shape of the gap was the first finding. Accuracy was not uniformly low: benefit lookups, two-thirds of the test set, scored 76.2%, while every other category cleared 93%.
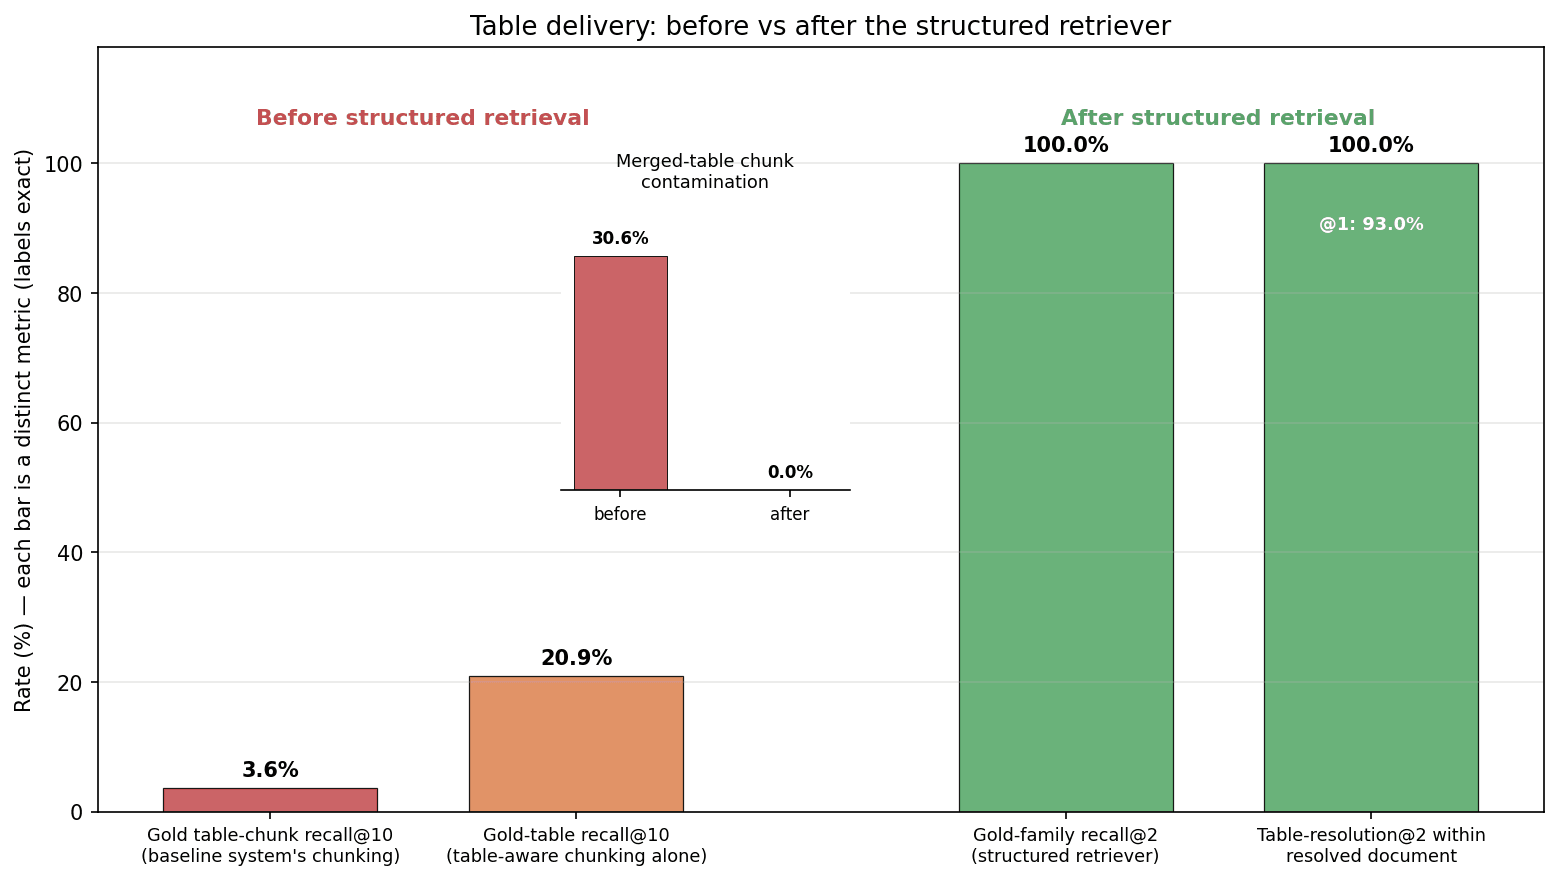
Underneath that category, the diagnosis chain was short and decisive. Benefit values live in dense numeric tables, and under the baseline system’s chunking, the correct table chunk almost never reached the model: gold table-chunk recall was 3.6% on the numeric value-lookup slice. Plan and plan-year filtering, by contrast, was essentially perfect; the failures were right-plan, right-year, wrong-document-or-section, about three-quarters of all misses. When the right document was retrieved, the system answered correctly 90.8% of the time; when it was not, 69.0%.
Two more measurements completed the picture. Handed the exact right table, the existing model read the correct value about 88% of the time, so comprehension was never the bottleneck. And nearly a third of table-bearing chunks (30.6%) contained rows from two or more different tables merged together, with one table’s rows bleeding into the next chunk: corrupted delivery even when something relevant arrived.
None of this contradicted the previous reading; it sharpened it. What the assessment added was the level beneath that estimate: which stage of delivery was failing, by what mechanism, and why no similarity-based fix could repair it. The conclusion the whole engagement rests on: this was a delivery failure, not a model failure. The assessment confirmed that retrieval was a significant factor in output failures.
What the Assessment Ruled Out — and Found Instead
Before proposing anything, the assessment spent its budget refining proposals with tests and gathering additional data. These were the four places an improvement budget would naturally have gone:
- A generator four to five times larger: no accuracy gain at all, and it made safety worse, flipping answers and introducing hallucinations the smaller model didn’t make.
- An embedding model nearly seven times larger: no retrieval gain; recall was flat, which is exactly why it was tested first and reported with the evidence.
- A better confidence algorithm: modest gains in discrimination, still effectively nothing safe to auto-accept, because a confidence model cannot accept answers the system gets wrong.
- Linearizing every table value into a searchable fact store: thousands of near-identical facts still don’t rank; the lookup fails the same way the chunks did.
The reason all four fail is structural, and it is the engagement’s central insight: benefit values are grids of near-identical numbers, across hundreds of look-alike same-plan tables, and no text-similarity ranking (dense, lexical, reranked, or fact-ized) can isolate the one authoritative cell. Scale does not fix that. Structure does.
What the assessment found instead was a structural path, validated component by component. A structured key (employer, plan, year, benefit line) plus document precedence located the authoritative source document 88–93% of the time, where similarity methods had managed at best about one in five; typed extraction then read the exact cell. Assembled and run end to end on a replica of the corpus, a prototype scored 90.6%.
The assessment refused to promise that number. The replica could not settle how heavily the library duplicates plan documents, so the honest range was 83–91%, the spread was flagged as the engagement’s number-one caveat, and the first week of the next phase was designed to measure it on the corpus before any build budget was spent. Validated, not yet built.
One corpus audit question (is everything a specialist would actually use wired into the assistant?) surfaced a legacy document repository left behind by a prior migration: roughly 600 retired plan documents, invisible to the assistant. Bringing it inside the system’s access-control and audit envelope was scoped at the gate as a fixed-fee change order.
Gate 1 — Go With Conditions
The first decision gate evaluated whether the improvement phase should proceed and, if so, under what controls. The assessment findings were reviewed from compliance, technical, operational, and implementation perspectives. The result was a conditional approval rather than an unrestricted authorization.
The conditions focused on four areas: privacy controls, validation governance, operational adoption, and delivery risk.
Privacy requirements included treating output redaction as a formal exit criterion and reporting detector performance separately for relevant categories of sensitive information. This was intended to prevent aggregate performance measures from concealing weaknesses in individual categories.
Technical governance requirements included documenting the proposed improvement method, jointly defining the initial validation thresholds. These conditions were designed to ensure that evaluation criteria were understood in advance and that the resulting system could be supported and scrutinized.
Operational conditions established recurring adoption reviews, a defined mechanism for pausing the pilot, and early testing against difficult escalation scenarios. Progression would therefore depend not only on benchmark performance, but also on demonstrated usefulness in representative workflows.
A central issue at the gate was whether the redaction pipeline could guarantee a minimum detection rate for every category of sensitive information. Such a guarantee was not adopted. Detection of identifiers in unstructured text is probabilistic, and an absolute assurance based on a single automated control would not be technically defensible.
The alternative was a risk-based, defense-in-depth approach consisting of:
- Measured performance by sensitive-information category.
- Explicit reporting of uncertainty and known limitations.
- Additional controls surrounding residual detection risk.
- Predefined actions if validation results fell below an agreed threshold.
This distinction was important to the gate decision. The objective was not to replace uncertainty with an unsupported commitment, but to make uncertainty measurable, visible, and actionable.
The improvement phase was therefore permitted to proceed subject to evidence from an early validation checkpoint. Continued investment and expansion would depend on performance against a representative corpus rather than completion of implementation activities alone.
A delivery contingency was also established. Capabilities were prioritized in advance so that, if schedule or validation constraints emerged, the initial release could be narrowed without weakening required privacy, access-control, or verification safeguards. Lower-priority capabilities could then be deferred rather than forcing an uncontrolled tradeoff near the release date.
The gate demonstrated the intended function of conditional governance. Approval did not eliminate disagreement or risk. It converted concerns into explicit controls, decision rights, validation criteria, and fallback actions. Responsibility for those protections was distributed across the relevant governance, technical, and operational functions rather than concentrated in a single project role.
Phase 2 — Fix Delivery First, Then Buy Capacity
The improvement phase opened with the predictions. Nine of them (accuracy, faithfulness, hallucination, access control, refusal behavior, the redaction control, prose quality, auto-accept, and time savings) were registered before any pilot data existed, each labeled committed or stretch.
One promotion happened at that kickoff. A duplication check on the document library had sampled thirty-two plan keys across the largest employer groups and found essentially one in-force source-of-record document per key. The assessment’s biggest open variable had resolved in the right direction, so answer accuracy moved from stretch to committed. The two predictions whose evidence had not yet arrived stayed held.
The build itself inverted the usual order: fix delivery first, then buy capacity. Delivery came from two changes working together. Table-aware chunking made every benefit table its own retrieval unit (never split, never merged with a neighbor), prefixed with a plain-language descriptor of what the table answers, so a grid of numbers becomes findable by meaning. And a two-stage structured retriever replaced similarity search where similarity cannot work: stage one resolves the employer, plan, year, and benefit line by metadata precedence to the single source-of-record document; stage two matches the question against that document’s table descriptors and delivers the top two tables whole. The system stopped searching for the right table and started resolving it.
With delivery fixed, model capacity finally converted into accuracy: the same class of upgrade that had measured zero gain in Phase 1 was now worth real points, because the right table was actually arriving. A 14-billion-parameter model took over generation on the same single GPU, chosen over nominally larger alternatives on a robustness test that the hardest tabular questions decided. The fine-tuning adapter, which measurement had already shown to be inert on accuracy, was retired; its one job, answer formatting, moved into deterministic code that does it perfectly. The method change was documented as a change order stating the record plainly: the method moved because the evidence did.
The phase also closed the loop on the assessment’s corpus discovery. The legacy repository’s roughly 600 retired plan documents were imported once, brought under the same access control and audit logging as everything else, and made searchable beside the live corpus — so the documents that govern the hardest appeals stopped being limited knowledge, and started being citable answers.
Week one ran as the checks the gate had demanded, and the discipline of moving exactly the numbers the evidence earned continued. The corpus-wide duplication census confirmed the original sample, so accuracy stayed committed. The scanned-document fidelity check met its zero-confident-wrong bar (on degraded scans the system abstained instead of misreading), but meeting that bar cost auto-accept coverage on the scanned stock, so auto-accept stayed a held stretch while ingestion hardening was built.
The other two checks resolved their predictions’ open conditions. The lookup-time study estimated that about 63% of lookup time is search rather than reading (at the assumption the time-savings model needed), so the time-savings prediction was promoted to committed. The system was run against hard escalation cases, including the coordination-of-benefits class that had broken the original pilot. On the rule-dependent cases it declined to answer and returned the two governing documents, cited; it computed the one case that was genuinely arithmetic and showed the cells it used.
The Commitment Layer — Auto-Accept Without Critical Errors
The most consequential performance measure was not overall accuracy, but whether the system could safely commit to a limited class of answers. A committed answer could bypass routine human verification only when the system had sufficient evidence to return an exact value without inference or interpretation.
A learned confidence score attached to a free-text response was not considered sufficient for this purpose. Such a score may estimate the likelihood that an answer is correct, but it does not constrain how the answer was produced or guarantee that its specific contents were extracted accurately.
The commitment layer therefore used a deterministic, typed-extraction process. For questions answered by structured tables, the process:
- Parsed the relevant table into a grid.
- Matched the question to a single row and column.
- Read the corresponding cell directly.
- Confirmed that the extracted value had the expected type and format.
- Returned the value only when every matching condition was unambiguous.
When multiple rows or columns were plausible, the value type did not match expectations, or the selected cell did not contain a single concrete value, the system declined to commit. The question was instead routed for human review with the relevant source material attached.
Under this construction, the absence of critical errors was treated as a property of the acceptance path rather than the result of tuning a confidence threshold. The path contained no operation that allowed the system to infer, estimate, or choose among ambiguous values. It could either extract a uniquely identified value or abstain.
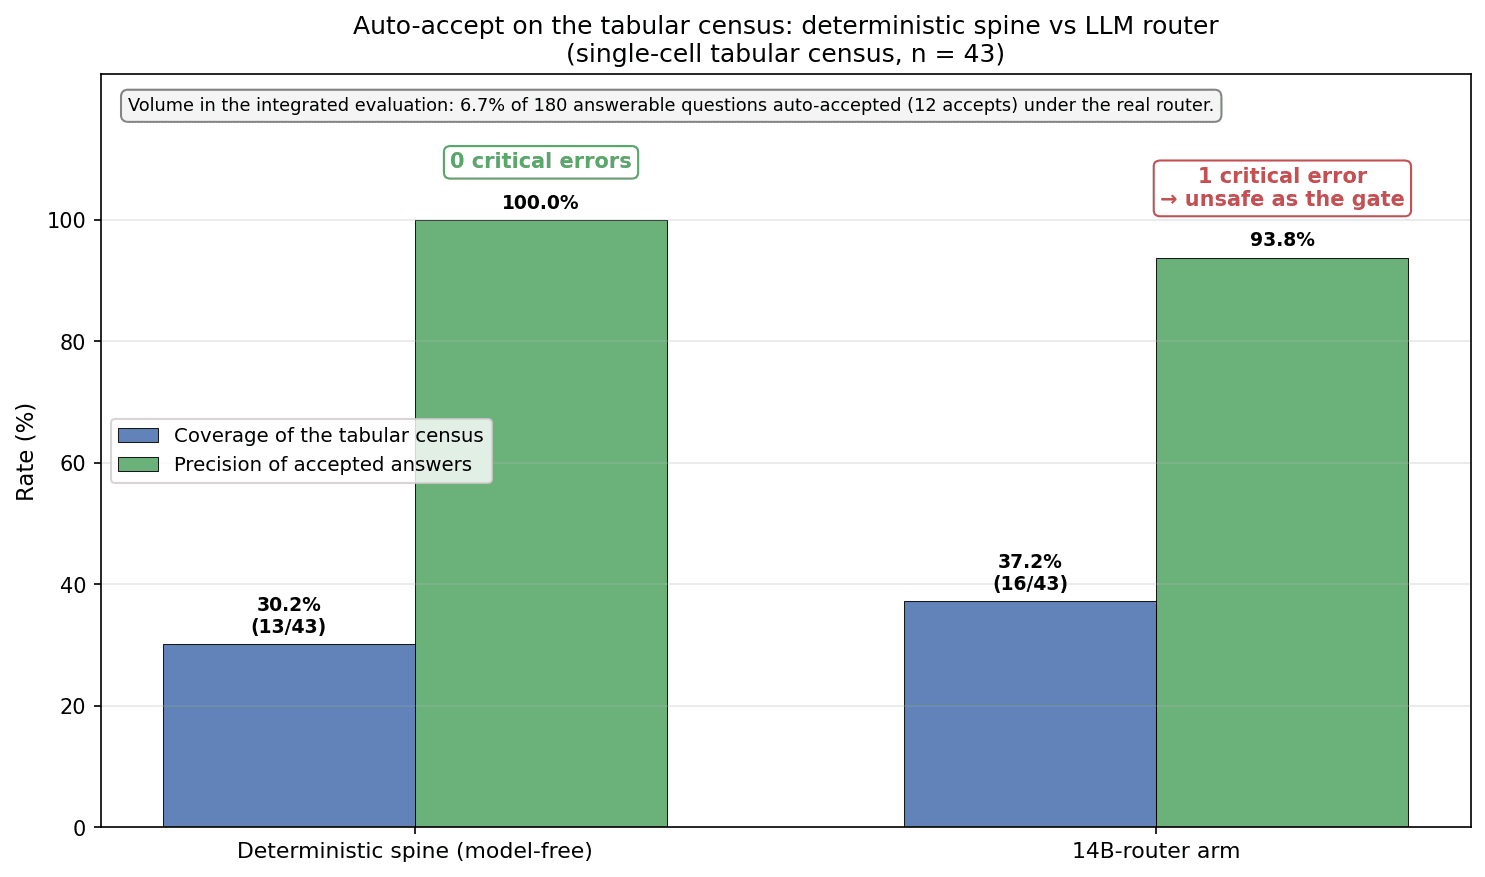
Evaluation on questions whose answers appeared in structured benefit tables showed that this approach could safely auto-accept a meaningful minority of eligible questions while maintaining perfect precision within the evaluated set. A model-based routing alternative accepted a larger proportion of questions, but it also admitted a critical error. Because the purpose of the commitment layer was to prevent confidently incorrect values from bypassing review, the higher-coverage alternative was not suitable for the acceptance gate.
This result illustrates the distinction between coverage and commitment safety. A system may increase automation by accepting more answers, but greater coverage is not beneficial when it weakens the guarantee attached to acceptance. For a high-consequence gate, abstaining on an uncertain answer is preferable to accepting a plausible one.
Auto-accept was therefore treated as a staged capability rather than an immediate deployment claim. Early evidence could establish that the deterministic path behaved safely under controlled evaluation, but it could not by itself demonstrate that the path would cover enough real-world questions or remain reliable across categories and document variations.
The validation process separated two claims:
- Safety claim: an answer is accepted only when a unique, correctly typed value can be extracted without inference.
- Coverage claim: a sufficient proportion of operational questions satisfy those acceptance conditions.
The first claim could be supported by the construction of the gate and targeted testing. The second required broader empirical evidence and could not be assumed from a small or unusually clean evaluation set.
A verification period was therefore used before any category became eligible for unreviewed acceptance. During this period, candidate auto-accepts remained subject to normal human verification and were compared with the verified outcomes. Results were tracked by question and answer category so that eligibility decisions could be based on observed performance rather than aggregate accuracy alone.
This staged evidence path provides a general model for introducing automation into regulated workflows. A capability should not bypass human review merely because preliminary results are promising. It should advance only after its safety conditions are explicit, its abstention behavior is tested, and its performance has been demonstrated across the categories in which it will operate.
The Result on the Same Hardware
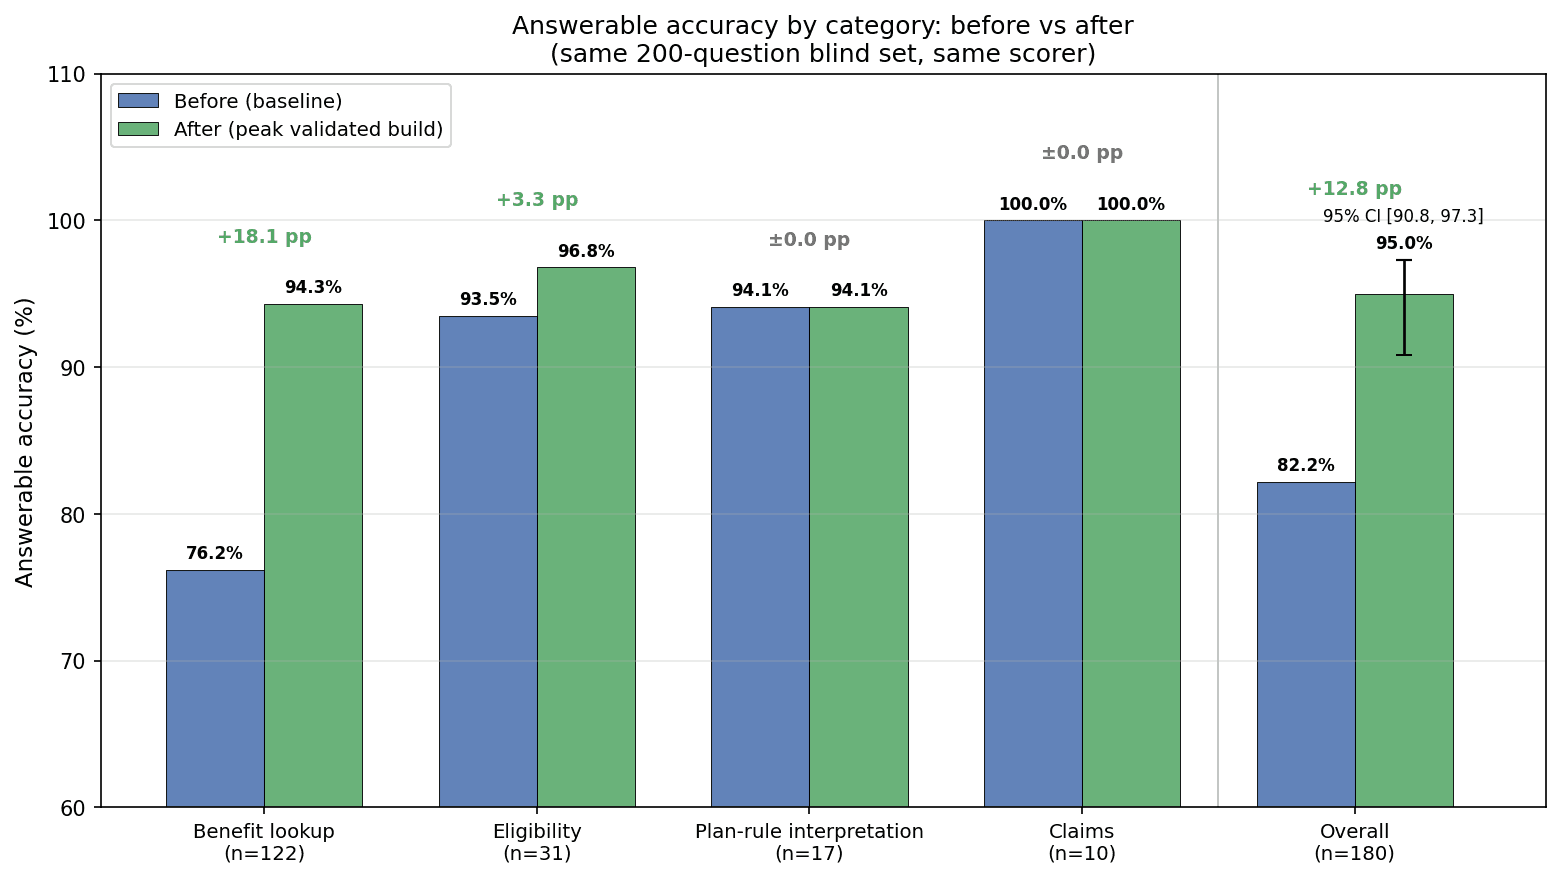
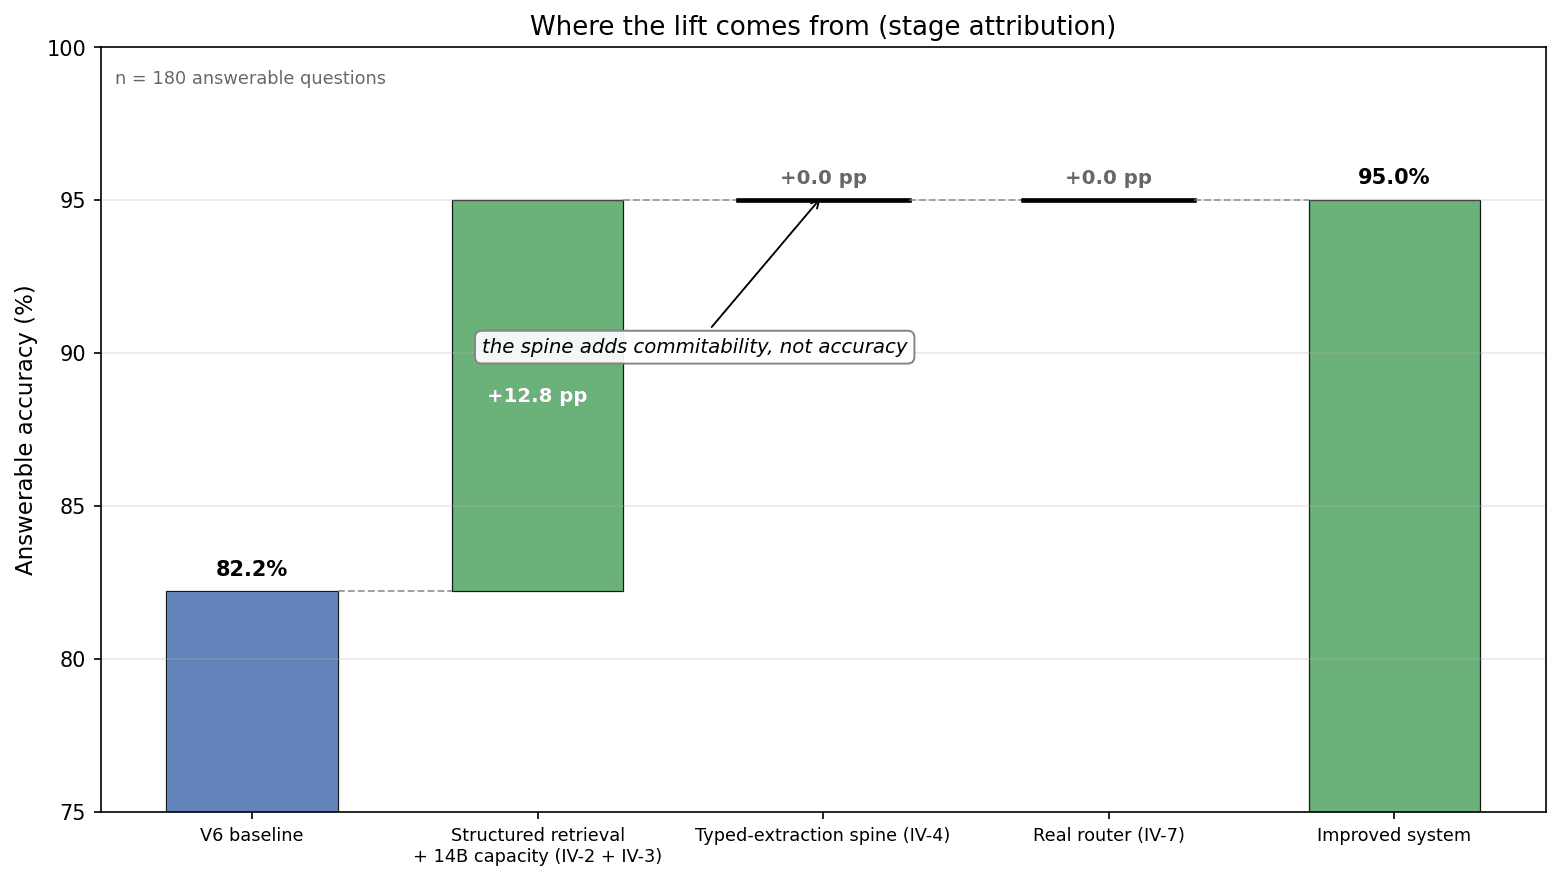
The integrated before-and-after came in at the midpoint of the pilot. On the same 200-question blind set, against the same scorer that measured the baseline, the improved system reached 95.0% answerable accuracy at the peak validated build, up 12.8 points from 82.2% — with the corpus confirming run still ahead as the thing that would make the number final. The gain sat exactly where the diagnosis said the problem was: benefit lookups moved from 76.2% to 94.3%, while the categories that were already strong stayed strong.
Just as important is where the lift came from. Measured stage by stage, the entire 12.8-point lift is retrieval plus model capacity. The typed-extraction spine adds zero accuracy points, and so does the production router: by the time a question reaches them, the system already has the right answer in hand. The spine’s contribution is the commitment layer: it converts answers the system already gets right into deterministic, citation-first, zero-critical-error auto-accepts — a different property from accuracy, earned by a different part of the architecture.
The safety profile was reported with the same precision, including its one regression. Refusal on the 20 adversarial questions improved from 90% to 95%, and not one adversarial bait ever reached the auto-accept path. Hallucination, however, moved from a measured zero on the baseline to 1.7% on the improved build’s generative path: a real regression, disclosed as one and characterized case by case, with the auto-accept path remaining at zero by construction.
The categories that were never broken stayed unbroken. Prose-answer quality on the non-table categories, a registered prediction of its own, stayed above its committed bar, and access control stayed perfect.
The operational numbers moved the same direction. The improved model produces its answer in about a second and a half, and the production system delivers it end-to-end in under four seconds at the median, against a baseline that averaged about 20 seconds and ran past half a minute at its worst.
And all of it runs co-resident on the existing hardware with measured headroom; the committed configuration required no hardware purchase at all. Every number was also handed over reproducible: each result traces to a script and a results file.
The Metric Trade-off and Configuration Selection
One evaluation metric remained below its target after the primary improvements were completed. The automated faithfulness score—generated by a natural-language-inference model that assesses whether each answer is supported by its cited source—measured 93.3%, compared with a 95% acceptance threshold.
Error analysis indicated that much of the measured gap reflected a limitation of the scoring method rather than unsupported system output. Approximately nine of the twelve flagged responses contained the correct benefit values and cited the appropriate source, but restated information from structured tables in language that the scorer could not reliably align with the original text.
Because scorer limitations can easily be invoked to dismiss unfavorable results, this interpretation was tested against alternative explanations. For example, removing standardized compliance language from the responses reduced the score further instead of improving the metric.
A model-policy adjustment was available: require the answer to reproduce the relevant source language before providing an explanation. This raised automated faithfulness to 95.6%, but reduced answer accuracy by 0.6 percentage points. The regression occurred on a question requiring a computed total. By reproducing two source values separately, the model omitted the calculation needed to produce the directly useful answer.
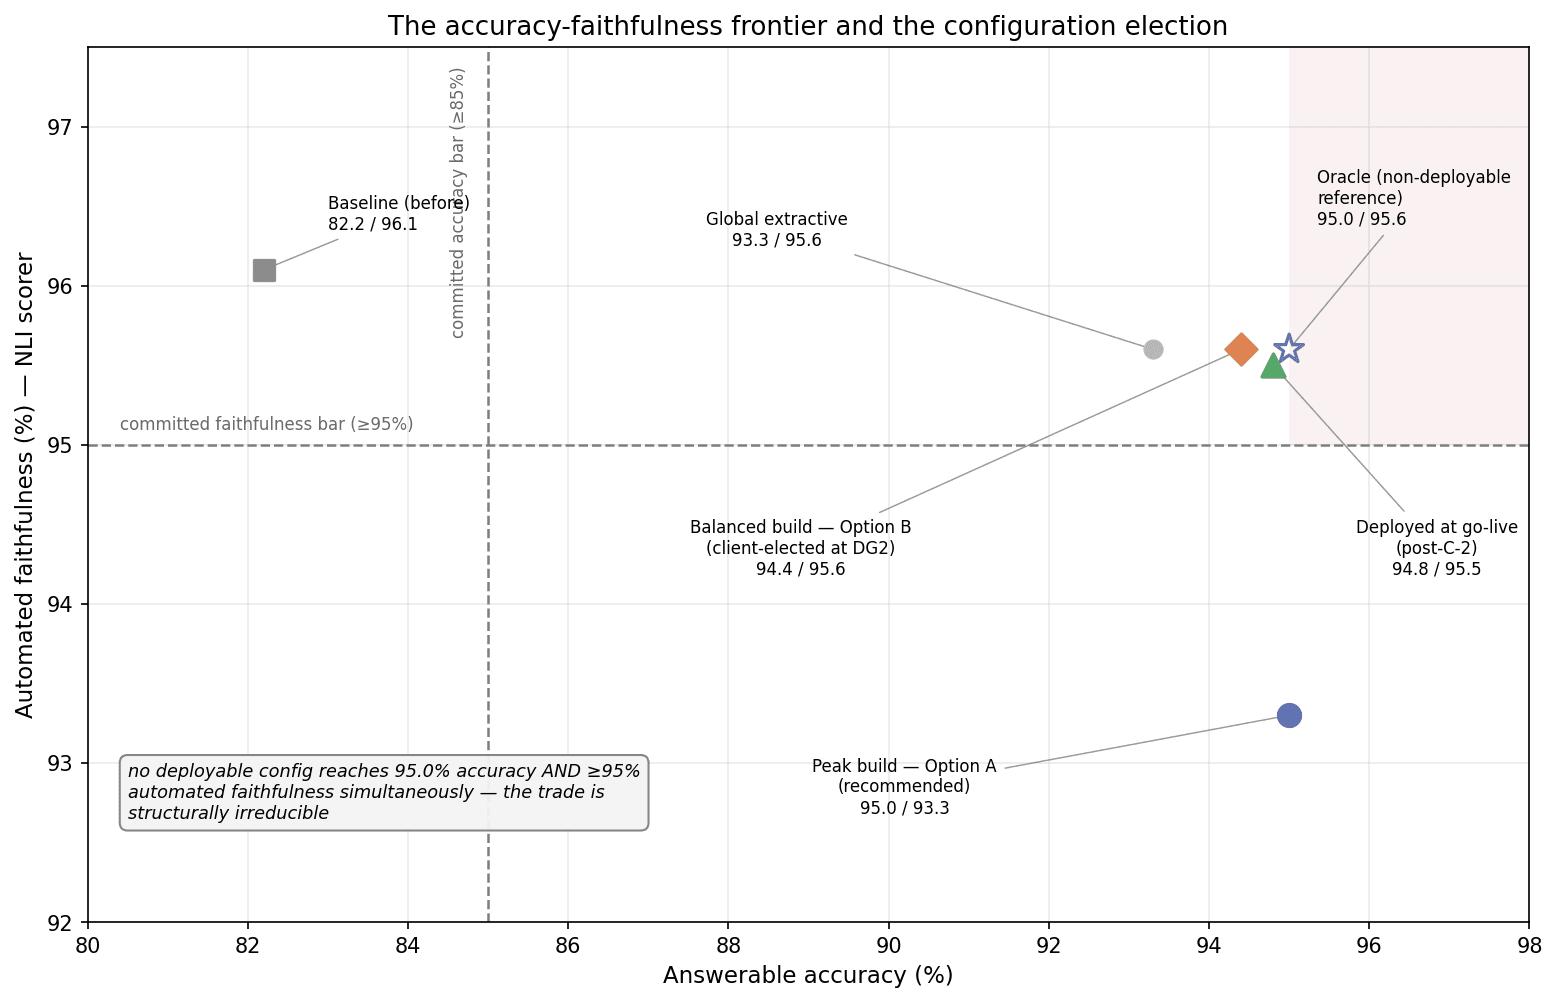
Evaluation across the deployable configurations revealed a persistent trade-off. The configuration with the highest answer accuracy did not satisfy the automated-faithfulness threshold, while the configuration that cleared the faithfulness threshold introduced a small but genuine accuracy loss. The available system signals did not reliably distinguish questions that benefited from verbatim extraction from those requiring synthesis or calculation.
Two validated configurations were therefore considered:
- A higher-accuracy configuration that retained peak answer performance but required human re-rating to resolve the apparent faithfulness shortfall.
- A balanced configuration that achieved 94.4% accuracy and 95.6% automated faithfulness, satisfying the established automated thresholds while accepting a limited accuracy reduction.
Under the registered evaluation methodology, human review was an appropriate mechanism for adjudicating scorer artifacts. This approach preserved the stronger accuracy result, while the balanced configuration remained available as an alternative for settings in which directly satisfying the continuously monitored automated metric was the higher governance priority.
The balanced configuration was selected for the initial implementation. Its principal advantage was not that it was unambiguously superior on technical grounds, but that its performance could be demonstrated directly through the standard monitoring framework. The modest reduction in accuracy was considered manageable within a workflow that already required source verification, while compliance with the automated threshold could be communicated and audited without an additional methodological explanation.
Both the technical recommendation and the configuration-selection rationale were documented. This distinction matters because a technically preferred configuration and a governance-preferred configuration may differ when evaluation metrics, auditability, and operational risk are considered together.
A subsequent refinement reduced the underlying trade-off. The extraction process was modified to distinguish between questions requiring a direct value from a single source cell and questions requiring a calculation across multiple values. On an expanded acceptance set, the refined configuration, the build that was ultimately deployed, achieved 94.8% answer accuracy and 95.5% automated faithfulness.
The final result retained most of the peak configuration’s accuracy while independently satisfying the automated-faithfulness threshold. More broadly, the evaluation illustrates that metric compliance should not be treated as a purely numerical optimization problem. Scorer behavior, answer usefulness, audit requirements, and the specific mechanisms behind regressions must all be considered when selecting a deployable configuration.
Phase 3 — Production Without Surprises
The productionization phase opened with the measurement that backstopped the whole story: the same before-and-after evaluation, re-run against the full document library. The first number came back lower, at 91.7%, because 162 scanned documents — about 18% of the plan-document library — were unreadable to character-level OCR, and the system was correctly refusing to trust what it could not read.
A vision-model ingestion path built for exactly this recovered those documents, and the validating run landed at 94.2% accuracy and 95.4% automated faithfulness on the corpus.
Production also delivered its one genuine incident, notable mostly for what didn’t happen. Under sustained load, the canary node (the 10% of traffic running the newest build) exhausted GPU memory and stopped completing requests. The automated rollback tripped as designed, returned that traffic to the stable build inside three minutes, and the error never surfaced in the output. The fix was a concurrency cap and a memory budget, plus a new headroom alert so the limit is enforced going forward.
The compliance surface closed on the build, meeting the qualifying conditions at the second gate. The answer-redaction control, a hard condition since that gate, was built, measured at 99.7% detection recall on a fresh holdout, and accepted. The access-control harness ran clean: zero violations across 4,000 queries, isolation tests passing 31 of 31. And the audit posture was packaged as control-mapping evidence tying the new system into the existing SOC 2 framework.
Operations hardening finished the phase. A disaster-recovery drill cut over to the warm standby in 2 hours 48 minutes against a four-hour objective.
The system: a deployed topology of eight containers on the one existing GPU, the full stack co-resident at roughly 93% VRAM capacity with measured headroom, and a monitoring stack of 15 metrics and 9 alerts.
Final Acceptance and Initial Operating Period
The final readiness review identified no material issues beyond those already documented in the pre-read. Nearly all acceptance criteria were satisfied. One criterion—a sustained endurance test under peak load—could not be completed meaningfully before the relevant demand period. Rather than treating the criterion as passed or failed, the measurement was deferred to the peak operating window, with a defined monitoring period and reporting date.
Observed time savings on benefit lookups fell within the target improvement range established for the evaluation.
The review also considered whether any question categories had accumulated enough evidence to permit responses without mandatory source verification. One narrowly defined category—direct lookups involving a single, unambiguous benefit value—was approved for graduated auto-acceptance after an extended verification period produced no critical errors. The decision considered both accepted responses and abstentions, since an effective control framework must evaluate when the system declines to answer as well as when it proceeds.
The graduated category remained subject to ongoing oversight. Its scope could be reduced if evidence indicated a change in risk, document quality, or system performance. All other question types continued to operate in assist mode, with human review required before the answer was used.
Operational readiness included the transfer of documentation, procedures, and training materials. The technical documentation was reconciled to the deployed build rather than describing an earlier design state. The runbook covered routine operations, monitoring, incident response, document ingestion, access-control validation, and rollback procedures.
During initial operation, accuracy and source-faithfulness results remained closely aligned with predeployment measurements. Approximately 1,100 responses in the graduated category were auto-accepted without a critical error. This converted a predeployment performance expectation into an observed operating result, subject to the scope and oversight controls.
Capacity monitoring generated one headroom alert during the initial increase in traffic. The configured concurrency controls handled the event without interruption or observable degradation, and no immediate hardware expansion was required. The deferred endurance measurement remained above its acceptance threshold throughout the initial operating period.
The initial operating period also tested procedures for managing changes to the underlying source material. A set of updated plan documents was ingested, validated against retained evaluation cases, and introduced without downtime. Document-precedence controls served the current plan-year materials while suppressing superseded versions, reducing the risk that an otherwise accurate retrieval would rely on outdated governing evidence.
One service issue remained open. The system abstained more frequently than necessary for a narrow class of questions arising during the overlap between plan years. The behavior was conservative: it reduced answer coverage rather than increasing the likelihood of an unsupported answer. The issue was documented, quantified, and assigned to the improvement backlog.
Overall, the initial operating period supported three conclusions. The system maintained its evaluated predeployment quality levels under operating conditions, the graduated auto-accept policy remained within its defined safety limits, and the operational handoff functioned when source documents changed. The remaining work concerned sustained-load validation and targeted improvements to answer coverage rather than correction of a fundamental safety or architecture problem.
What This Means for Your Organization
Some of this transfers directly. The assessment-first economics: every improvement went to mechanisms a two-week assessment had already validated, and none went to the four options that the data ruled out. That is the difference between buying a diagnosis and buying a guess. The governance pattern: phased commitment with exits, predictions registered before data and scored regardless, bad news routed to its owner before the gate instead of surfacing at it.
The deployment posture transfers too. Everything here ran on existing hardware with data never leaving the environment, and the constraint that disqualified non-self-hosted AI turned out not to cost a single point of metric result. For organizations whose data cannot leave the building, that is the finding: the compliant path and the performant path were the same.
What does not transfer is the specific numbers. This bottleneck was benefit-table delivery; yours may be something else, which is why the engagement starts by measuring. What generalizes is the method: reproduce the baseline, localize the failure, rule out the expensive non-fixes with data, fix the mechanism, and validate on your own data before anything is committed.
Why This Engagement Model Is Low-Risk
- You can stop at every gate. Each phase ends at a decision gate with pause and exit options, priced at work performed to date, no termination fees. Continuing is always your decision, made on that phase’s evidence.
- Commitments are tiered and earned. Committed numbers carry evidence; stretch numbers carry labels. A number is promoted only when its gating evidence arrives — never to improve a slide.
- The predictions are scored either way. Registered in writing before pilot data, reported pass-or-fail at the gates regardless of outcome. Here, all nine held — and the record of how they were held (including the one that stayed a stretch through five holds) is part of the deliverable.
- Conditions are your protection, and they are welcomed. The thirteen conditions at the first gate and sixteen at the second, and every one was either discharged or carried forward explicitly by the end.
- Rollout is assist-first, with automation graduated on evidence. The initial deployment was done in assist mode and auto-accept reached production only by category, only on a demonstrated zero-critical-error record.
- Access is engineered like a control. RCTK works under a business-associate agreement, through a minimum-necessary service account a client can suspend, with sensitive data never leaving a client’s environment and access logs reviewed by a client’s own compliance function.
- The spend is matched to the evidence. Build budget is gated behind a validation on the data, with a pre-agreed remedy (de-scope with credit, or exit) if the evidence comes back wrong.
What This Engagement Demonstrates
- Reproduce before you critique. The assessment’s first act was to confirm the numbers on the existing system, which is also what made the diagnosis credible.
- Rule out the expensive fixes with data. A bigger model, a bigger embedder, a better confidence algorithm, and a fact store were each tested and each measured as nulls before the time budget went where the evidence pointed.
- Register predictions before the data exists. Nine predictions, in writing, at kickoff, scored at the gates pass-or-fail. Selective promotion (moving exactly the number whose evidence arrived, holding the ones whose evidence hadn’t) is what made the committed labels mean something.
- Surface the bad number before the gate. The 93.3% automated-faithfulness reading was reviewed, with the full trade-off and a recommendation, before the gate was approved.
- Record the recommendation and the election. When the balanced build was selected over the recommended peak configuration, both positions went into the gate record with the reasoning. Decisions belong to the people who are responsible for defending them.
- Name the deferral; never lower the bar. The final gate closed at nineteen of twenty, with the remaining criterion scheduled into the only window that could actually measure it.
- Abstention is a feature. The system that can win back users is the one that declines to guess, cites what it found, and hands the judgment call to the human. It is the designed answer to the confident wrong answer that started this story.
Working With RCTK
RCTK is a one-consultant practice, and it runs engagements the way this one ran: a short assessment first, decision gates with exits, predictions in writing before the data exists, and production claims earned on your data, not asserted from a generalized benchmark. If your organization has an AI system it cannot yet trust, or a regulated workflow where a confident wrong answer costs more than minutes, the conversation starts with measurement — book a free consultation.
Part II
Technical and Governance Detail
Part I told the story in plain language. What follows is the complete record behind it: the evaluation methodology with its denominators and scorers, the baseline as built, the seven-stage improvement program, the faithfulness trade-off and the recorded election, the productionization and operations evidence, and the decision-gate and prediction outcomes. Every quantitative claim traces to a result file or a named engagement document.
Instrument: 200-question blind set (180 answerable / 20 adversarial), expanded to 300 questions at acceptance | Deployed build: 14B-parameter open-weights LLM (4-bit) on one GPU
1. Executive Summary
RCTK was tasked with assessing and improving a previously built on-premise retrieval-augmented assistant: 82.2% answerable accuracy against an 85% target, zero answers safe to auto-accept, and an imposed ban on non-self-hosted third-party LLMs. The engagement ran as three phased stages, each closing at a decision gate with standing pause-and-exit rights, with nine predictions registered before any pilot data existed.
The assessment localized the failure to a single stage (delivery of benefit tables to the model) and ruled out the obvious capacity fixes with direct measurements before any improvement budget was spent. The improvement program rebuilt retrieval around a structured key and table-aware ingestion, bought model capacity only after delivery was fixed, and added a deterministic typed-extraction spine that auto-accepts single-cell answers at zero critical errors by construction. On the same 200-question blind set, against the same automated scorer that measured the baseline, the integrated system reached 95.0% answerable accuracy at the peak validated build (171/180, 95% CI [90.8%, 97.3%]), with the entire +12.8-point lift attributable to retrieval plus model capacity, on the same single GPU. At the second gate a balanced configuration (94.4% accuracy / 95.6% automated faithfulness) was selected over a higher-accuracy build, both positions recorded; a Phase-3 refinement then lifted the deployed build to 94.8% / 95.5%.
T1 — Engagement overview (durations in relative time)
| Phase | The question it answered | Gate outcome |
|---|---|---|
| Discovery | Is there a fixable problem, and under what access, compliance, and commercial protections? | MSA, BAA, and Phase-1 SOW |
| Phase 1 — Assessment | What is actually broken, is it fixable on the existing hardware by the committed date, and what would fixing it take? | GO with conditions — 13 registered |
| Phase 2 — Improvement pilot | Would the validated fix deliver, measured before/after on the same set and scorer? | GO with conditions — 16 registered |
| Phase 3 — Productionization | Would the result transfer to the actual corpus? | ACCEPT at 19/20 criteria; the remaining criterion deferred to its measurement window |
| Production and support | Would the numbers hold on traffic after handoff? | First support cycle met every committed bar |
T2 — The decision funnel
| Decision point | What was decided | Recorded outcome |
|---|---|---|
| Assessment → DG1 | Proceed past a clean audit-only exit | GO with conditions; the improvement build budget gated behind a Week-1 corpus validation |
| Phase-2 kickoff | Which predictions to commit | Nine predictions registered; accuracy promoted to committed on the duplication check; auto-accept and time-savings held to their own evidence |
| Week-1 go/no-go | Release the build budget | Checks passed; time-savings promoted; auto-accept held again on scanned-stock coverage |
| Mid-pilot review | Report the integrated result | 95.0% peak reported with corpus caveat attached; auto-accept held a fourth time; the method swap documented as a change order |
| DG2 | Configuration election and Phase-3 authorization | GO with conditions (16); elected the balanced build (94.4% / 95.6%) over the peak accuracy build — recommendation and election both recorded |
| Phase 3 | Validate on the production library | 91.7% raw with the cause identified → 94.2% / 95.4% after vision-model recovery of 162 scanned documents; refinement C-2 produced the deployed 94.8% / 95.5% build |
| DG3 | Accept for production | ACCEPT 19/20; auto-accept graduated for exactly one category on a four-week zero-critical-error verification record |
| First cycle | Operate | Live on the committed date in assist mode; first sample 94.7% / 95.4%; ~1,100 auto-accepts at 0 critical errors |
Headline before/after (same 200-question blind set)
| Measure | Before (baseline) | After (improved) |
|---|---|---|
| Answerable accuracy (n=180) | 82.2% (148/180) | 95.0% peak validated build (171/180, CI [90.8%, 97.3%]) · 94.4% elected · 94.8% deployed |
| Benefit-lookup category (n=122) | 76.2% | 94.3% (+18.1 pp) |
| Citation faithfulness, automated NLI (n=180) | 96.1% | 93.3% on the peak build (substantially a scorer artifact; §6) · 95.6% elected · 95.5% deployed |
| Hallucination (n=180) | 0.0% | 1.7% — a disclosed regression, generative path only (§5.7); the auto-accept path stays at 0.0% |
| Refusal on the 20 adversarial questions (reported separately) | 90.0% | 95.0%; zero of the twenty ever reached the auto-accept path |
| Auto-accept | 0.0% at every confidence threshold | 6.7% of answerable under the router (12/180) at 100% precision and 0 critical errors; 30% of the 43-question tabular census |
| Latency | 20.6 s mean / 37.1 s P95 | ~1.5 s generation per query (production end-to-end p50 3.6 s — §8.2) |
| Hardware | One GPU | The same card; nothing added at any point |
Instrument note: the deployed-build accuracy and faithfulness readings (94.8% / 95.5%) are acceptance measurements on the expanded 300-question production instrument (§6.4, §8.2); the baseline, peak, and elected readings are the 200-question pilot instrument.
The remainder of Part II: methodology (§2), the baseline (§3), the assessment (§4), the improvement program (§5), the faithfulness trade-off and the election (§6), productionization and operations (§7), gate and prediction outcomes (§8), production results (§9), the evidence index (§10), and two appendices (the prediction protocol; the deployed stack reference).
2. Engagement and Evaluation Methodology
2.1 The assessment-and-improvement shape
This was not a greenfield build. A functioning, competently engineered system existed with a measurable baseline, so the engagement’s first phase was an assessment of that system: reproduce its reported numbers independently, localize the failure, test the candidate fixes directly enough to keep or discard each one, and validate an improvement path component by component. The improvement phase then implemented the validated path with each intervention measured before the next was started, so the final lift could be attributed to its components rather than asserted (§5.7). The productionization phase transferred the result to the corpus under acceptance criteria fixed in advance. The fallback was set: if the assessment had found gaps too large to close before the deadline, the engagement would close cleanly at the first gate as an audit.
2.2 Decision-gate governance and the conditions discipline
Each phase ended at a decision gate where the choice was proceed, pause, or exit. Gate deliverables were written as pre-reads ahead of each meeting; bad news was in writing before the gate, not surfaced first in the meeting (the faithfulness trade-off memo of §6 and the production incident of §7 are the two worked examples). The gates produced approval conditions (13 at DG1, 16 at DG2), which tracked to closure across the engagement (§8). By the third gate, the pre-read could state plainly that nothing presented would be new.
The conditions followed one register discipline across all three gates: each carries a verifiable criterion and a due gate; each is discharged in evidence or explicitly carried forward; and the register is reviewed at every subsequent gate. The same protection ran in both directions: success criteria moved only by approved change request. A status cadence carried the discipline between gates; the engagement’s one production incident reached that period’s status report, not at the next gate (§7).
Incidents ran under the same written discipline: a severity model with agreed service-level windows for acknowledgment, plan, and resolution; the operating rule of classifying fast on the worst plausible read and then re-classifying with written reasons as facts arrive; and routing with compliance pulled in parallel only when an incident actually has a compliance dimension.
2.3 The pre-registered prediction protocol
Predictions lived in two tiers. Committed meant high diagnostic confidence with the fix well understood: a miss is a serious, reportable event carrying a root-cause analysis. Stretch meant residual uncertainty, usually because a fix was validated but not yet built at corpus scale or depended on an unconfirmed corpus characteristic: a miss is informational. Nine predictions were registered at the Phase-2 kickoff, before any pilot data existed, to be scored at the gates pass or fail and reported regardless of outcome.
The protocol’s teeth are in selective promotion: a number moves from stretch to committed only when its gating evidence arrives. At the kickoff, exactly one prediction was promoted (answer accuracy, on the strength of a duplication check run on the library), while auto-accept and time-savings were held to their own Week-1 evidence. The auto-accept stretch was subsequently held, in sequence, at the first gate, the kickoff, the Week-1 check, the mid-pilot review, and the second gate — five holds in all — before graduating to production on a verification record (§8; Appendix A gives the worked example). The full scorecard, including the one prediction that finished as a held property rather than a clean pass, is in §8.
What keeps the registration from being a list of goals is two mechanics. Commitments are thresholds with margin, not point estimates: accuracy was committed at ≥85% while the expected landing point was around 90–91%, so the commitment could survive ordinary measurement noise without putting the threshold at risk. The downside was owned in advance: a committed miss is reported as a serious event with a root-cause analysis, with no after-the-fact reclassification. And every held prediction carries a stated dependency (auto-accept was held on scanned-table ingestion fidelity, time-savings on the measured search-versus-read split), so a “stretch” label points at a specific open variable instead of hedging by reflex.
2.4 Evaluation methodology and denominators
All pilot-stage numbers in this report come from one instrument: a 200-question blind test set built from call patterns, finalized before any pipeline tuning, and excluded from all training data. Its composition: 180 answerable questions across four categories (benefit lookup 122, eligibility 31, plan-rule interpretation 17, claims 10), each with a gold answer and gold citation, spanning six employer groups so that access-control-scoped retrieval is exercised; difficulty bands of 67 / 41 / 72 (levels 1–3); and a deliberately hard 40-question edge-case tier inside the 180. The remaining 20 questions are adversarial, constructed to be refused: plans outside the asker’s service scope, false premises, questions whose answer is contradicted across superseded documents, and framings that bait a confident answer from a passage that does not support it.
Denominators, used consistently throughout both parts: “answerable accuracy” is scored on the 180 answerable questions only. Refusal behavior on the 20 adversarial questions is reported separately and never blended into accuracy — baseline 90.0%, improved 95.0% adversarial refusal, and zero of the twenty ever routed to the auto-accept path at any operating point.
Scoring used the identical automated scorer before and after every change: bidirectional NLI entailment plus numeric match for value answers scores accuracy; NLI adherence ≥ 0.70 of the answer against its cited passage scores faithfulness; asserting a specific fact no retrieved passage supports scores hallucination. This design does two jobs at once. Because the set and scorer never changed, every before/after delta is apples-to-apples even where the scorer’s absolute level carries bias. And the scorer’s one known artifact, under-crediting a correct table value restated in prose, was identified, diagnosed, and handled in the open: it is the subject of §6, and a human re-rating was retained alongside the automated number for that reason. The live measurements (time savings, adoption, production accuracy) belong to Phase 3 and the support cycle (§§7–9).
One more note about the instrument belongs here, because every absolute number in this report inherits it: an automated NLI scorer is known to over-credit short or generic answers, so absolute levels carry an optimism bias even where relative comparisons are reliable. The engagement’s design leans on the relative reading (identical set, identical scorer, before and after) and pre-registered a human re-rating protocol for the one metric, citation faithfulness, where the automated instrument’s specific weakness mattered most (§6).
2.5 The synthetic corpus and the scale caveat
Improvement experiments ran on a synthetic, production-faithful replica of the corpus — roughly 8,000 documents scaled up from the ~1,200-document live inventory, deliberately over-duplicated (a median of roughly fifty value-similar sibling documents per benefit key) so the delivery problem was stressed harder than production would stress it. The replica reproduced the baseline’s metrics exactly, which validates the measurement harness; it was not claimed to validate corpus structure. The two characteristics a replica cannot establish (how heavily the library duplicates documents, and whether scanned-table values survive text extraction) were flagged as the engagement’s #1 caveat at the first gate and retired in stages: a pre-signature duplication sample across 32 stratified benefit keys (finding essentially one in-force source-of-record document per key), the Week-1 corpus-wide census that confirmed it, and the Phase-3 validating run on the production library itself (§7), which reported 91.7% raw and 94.2% / 95.4% after the scanned stock was recovered. Every pilot number in §§3–6 should be read with that pedigree in mind: measured on the replica, transferred to production under a gate designed for the purpose. Where the replica’s duplication artifact binds a metric, the engagement reported paired readings, production-faithful and replica-pessimistic; §4.4 and §5.1 carry the worked examples.
3. The Baseline System (the “Before”)
3.1 Architecture as built
| Layer | Baseline configuration |
|---|---|
| Generator | 8B-parameter open-weights LLM (BF16, greedy decoding) — selected to keep a LoRA fine-tuning path open after the originally planned model’s architecture proved structurally incompatible with adapter training |
| Domain adaptation | QLoRA adapter, rank 16, alpha 32, attention-only |
| Embedding | 0.6B-parameter embedding model (dense, 1024-dim) |
| Retrieval | Hybrid dense + BM25 with reciprocal-rank fusion; a cross-encoder reranker over the fused candidates |
| Document filtering | Two-tier: employer ACL filter, then similarity threshold 0.52 |
| Chunking | 512-token target, heading-aware, table-preserving within the token limit (§4.3 — better than the documentation described) |
| PII | Layered open-source PII detection (pattern + NER engines) plus custom recognizers; post-generation answer scrub |
| Confidence / auto-accept | 7-feature logistic regression (held-out test AUC 0.667) |
| Verification | Post-generation NLI entailment check |
| Serving | Single GPU; chat-platform front end; document-store and wiki corpora |
3.2 The baseline scorecard
Independently reproduced on the 200-question blind set, matching the reported figures exactly and validating both the measurement harness and the team’s measurement discipline. Five of eight gate criteria passed:
| Criterion | Target | Baseline | Status |
|---|---|---|---|
| Answerable accuracy (180) | ≥ 85% | 82.2% (148/180) | FAIL |
| Citation faithfulness (automated NLI) | ≥ 95% | 96.1% | PASS |
| Hallucination | ≤ 3% | 0.0% | PASS |
| Refusal on the 20 adversarial questions | ≥ 90% | 90.0% (18/20) | PASS |
| Document-level ACL | 100% | 100% (0 violations on the 200-query baseline eval) | PASS |
| Un-redacted PII in answers | 0 | 0 | PASS |
| Adapter semantic effect (Cohen’s d) | ≥ 0.3 | −0.021 | FAIL |
| Auto-accept at zero critical errors | ≥ 25% | 0.0% at every threshold | FAIL |
3.3 Where it failed, precisely
| Category | n | Accuracy | Gold-document recall@10 (slice) |
|---|---|---|---|
| Benefit lookup | 122 | 76.2% | 60.7% |
| Claims | 10 | 100.0% | 70.0% |
| Eligibility | 31 | 93.5% | 51.6% |
| Plan-rule interpretation | 17 | 94.1% | 70.6% |
The category shape (F2, Part I) is the diagnosis in miniature: one category, two-thirds of the set, carried essentially the whole gap. By difficulty, the middle band was weakest (level 1: 88.1%; level 2: 73.2%; level 3: 81.9%). The 32 failures decompose into 22 retrieval-bounded (the gold document never reached the delivered top-10), 5 model false-refusals, and 5 wrong-number extractions. Conditional accuracy: 90.8% when the gold document was retrieved, 69.0% when it was not. The reader was capable; delivery was the ceiling. Overall, the correct source document reached the model only about six times in ten, confirming the pre-engagement estimate (the instrumented per-category figures are in the table above). One scoring note: the recall column above is the baseline harness’s own document-match metric, quoted because it is the instrument used; the assessment’s stricter exact-source and looser family-level forensics in §5.1 are different instruments and read lower and higher respectively.
Operationally, mean latency was 20.6 s (P95 37.1 s): most likely marginal for a specialist on a live call. And the confidence model could not rescue trust: at test AUC 0.667, it auto-accepted nothing at any threshold, because a confidence score bolted onto a free-text answer cannot accept answers the system gets wrong.
The verdict the assessment delivered, and this report stands behind: a defensible internal build (strong citations, perfect isolation, honest refusals, clean PII hygiene) with one broken stage, which is what made a targeted engagement viable at all.
4. The Assessment (Phase 1)
4.1 Reproduce first
The assessment’s first act was to re-run the 200-question evaluation through the system with an independent harness, scoring with the same NLI methodology. It landed on 82.2% answerable, the reported figure to the decimal. That mattered methodologically (every later before/after stands on this harness) and organizationally.
4.2 The root-cause chain
- The failure was categorical, not general. Benefit lookups: 76.2% (n=122). Every other category: ≥ 93.5% (§3.3).
- It was not a plan-selection failure. Plan and plan-year filtering measured essentially perfect — 0% wrong-plan on the 60-question localization sample (at most ~6% at the 95% upper bound). Of the localization misses, 76% were right-plan, right-year, wrong-document-or-section; a manual classification attributed ~78% of accuracy errors to tabular value-lookups (an annotation, corroborated by the instrumented category and delivery measurements).
- The diagnosis number: gold table-chunk recall@10 under the baseline system’s chunking was 3.6% on the numeric value-lookup slice: the correct table chunk almost never reached the model’s context. (The report uses several distinct recall metrics; each appears only under its exact name.)
- Delivery, not comprehension. Conditional accuracy was 90.8% with the gold document retrieved versus 69.0% without it; handed the exact correct table, the existing 8B model read the right value ~88% of the time.
- What did arrive was often corrupted. 30.6% of table-bearing chunks merged rows from two or more distinct tables, and the chunker’s 50-token overlap prepended the previous table’s tail to each table chunk — cross-table numeric contamination even when something relevant was delivered (quantified in full by the Phase-2 index forensics, §5.1).
- The structural conclusion. Benefit values are grids of near-identical numbers across hundreds of look-alike same-plan tables. No text-similarity ranking (dense, lexical, cross-encoder, or fact-ized) can isolate the one authoritative cell. That is not a problem more scale can fix; it requires structure.
4.3 Ruled out, with data
The four places an improvement budget would naturally have gone were each tested directly, on the live system, before Phase 2 was scoped:
| Intervention tested | Measured result | Verdict |
|---|---|---|
| A 4–5× larger generator (8B → 35B, retrieval held fixed) | Accuracy +0.0 pp — 12 of 180 answers flipped, offsetting; faithfulness 96.1% → 86.7%; hallucination 0.0% → 3.9% | No accuracy gain; a safety regression |
| A 6.7× larger embedder (0.6B → 4B, with and without native query prompting) | Recall@10 0.717 → 0.700 on the matched sample | Clean null |
| A better confidence algorithm (gradient boosting + added observable features) | AUC 0.660 → 0.709 on matched labels (the production model’s held-out test AUC reads 0.667 in §3.1); auto-accept still ≤ 2.2% at P ≥ 0.97 | Correctness-gated — a confidence model cannot accept answers the system gets wrong |
| Linearizing tables into a searchable fact store (63,293 facts) | Strict gold-fact recall@8: 7%; authoritative-source index recall@8: 21% | Thousands of near-identical same-plan facts still do not rank |
Cheaper text-based delivery patches measured the same way: metadata-targeted table delivery 21%, section/parent-table expansion 36% — directionally better, capped by document recall. One inherited null was a correction: the chunking was already heading-aware and table-preserving within its token budget (better than the root-cause analysis described), so “fix the chunking” alone was never the lever either. The residual was table flattening on roughly 9% of plan documents, a contributor but not the cause.
Two of these nulls were re-tested later: the embedder null was re-confirmed on the improved index under fair, instruction-prompted conditions (§5.1), and the capacity null, measured on broken delivery, was re-opened from scratch once delivery was fixed — where it reversed (§5.2). A null is a measurement of a system state, not a permanent truth.
4.4 The validated path — component by component, then assembled
- Locate. A structured key (employer, plan, year, benefit line) plus document precedence located the authoritative source-of-record document at 88–93% precedence-recall, where text similarity had managed 3.6–21%. Structure solved the locate problem no similarity method could.
- Read. Typed extraction — select the cell coordinate, read the value verbatim in code, abstain on ambiguity. Integrated with no oracle on the full 43-question tabular census, structured delivery scored 83.7% [70%, 92%] against the 46.5% identical-generator baseline, lifting the hard numeric core from 16% to 72%, with faithfulness up and zero hallucination. For auto-accept, generate-then-ground reached 56% coverage at ~88% precision but took 3 critical errors; inverting the step (select → read verbatim → abstain) measured 26% coverage at 100% precision and zero critical errors, model-free. That zero is a property of the construction, the gate cannot accept what it had to guess at — which is why the assessment registered the coverage number as a stretch rather than a commitment.
- Assemble. With a question router over the whole 200-question set, the prototype measured 90.6% answerable [85%, 94%] at the F1-optimal operating point on the production-faithful reading. The assessment refused to promise that number: the replica could not settle how heavily the library duplicates plan documents, so the honest range was 83–91%, flagged as the engagement’s #1 caveat, and the first week of Phase 2 was designed to measure the deciding variable on the corpus before any build budget was consumed. The gate record carries the phrase “validated, not yet built.”
The assessment also stress-tested its own candidate component, and disclosed the three places the bare deterministic gate broke. Heavy query abbreviation produced 2 of 11 confidently wrong reads, closed by query normalization (11 of 11 correct after). Light OCR character corruption in scanned tables produced 2 of 11 confidently wrong reads: a corrupted value can still look type-valid, so ingestion fidelity, not the in-system type check, was identified as the binding control and became a Week-1 gate item (and, eventually, §5.5). Disagreeing superseded or duplicate tables were picked silently by the bare gate (0 of 3 safe); a routed model backstop measured 3 of 3 safe abstentions, with precedence and provenance at delivery adopted as the primary mitigation. Each failure mode and its mitigation went into the gate deliverable; the bare component was never proposed for deployment alone. And on the question class that had broken the pilot (coordination of benefits across two documents), the validated path computed what was genuinely arithmetic (3 of 3) and safely abstained where the answer was rule-dependent (3 of 3), at zero critical errors — made safe, not automated, and the assessment said which.
The #1 caveat was given teeth in two ways. The Week-1 check was delivered as a pre-built instrument, demonstrated on the replica (where it correctly detects both the duplication and the OCR corruption it exists to find), so Week 1 would supply a reading on the corpus rather than a methods debate. And the downside was priced before the gate: if the validation failed, the choice could be made to de-scope to the committed tier, or exit at work performed to date. That fallback scenario (roughly the baseline’s accuracy, with the safety, corpus, and verification-tax work intact but not the accuracy gain) was written into the assessment itself, so an actual executive conversation would have been early and informed.
4.5 The surfaced finding
The legacy repository. The corpus audit asked the inverted question (is everything a specialist would actually use wired into the assistant?) and surfaced a legacy document repository on a retired file server, left behind by a prior migration: roughly 600 retired plan documents, invisible to the assistant, and to its access controls. Classified as a non-reportable internal control finding; scoped at the gate as a change order importing the corpus under the same audit envelope as everything else. The discovery doubled as a root-cause insight: the documents governing the hardest questions were exactly the ones the system could not see.
The gate that closed the phase is narrated in Part I and scored in §8.
5. The Improvement Program
Seven engineering stages, each measured before the next began, all on the instruments of §2.4. This section compresses each stage to its findings and decisions; the stage designs, sweeps, and per-question diagnostics live in the improvement evaluation report and the seven stage reports indexed in §10.
5.1 Retrieval — structured delivery (IV-2)
Forensics on the baseline index first: across the 200-question set, gold-document recall@10 was 28.3% (exact source-of-record) and gold-family recall@10 75.6%, with gold-table recall@10 on the 43 table questions at 18.6%; 24.1% of chunks contained a table, 30.6% of those merged two or more distinct tables, 39.2% mixed table with prose, and the 50-token overlap bled each previous table’s tail into the next chunk.
The fix had two parts working together. Table-aware, document-type-specific chunking: every table becomes its own chunk (never split, never merged, zero overlap), prefixed with a structured descriptor (section title + column headers + row labels) so a grid of numbers becomes retrievable by what it answers; noise-bearing and sensitive-content tables are flagged out of value retrieval. On the full corpus this produced 10,969 isolated, descriptor-tagged benefit tables and took merged-table contamination from 30.6% to 0.0%, with the gold table present in its own document’s chunks 100% of the time. A two-stage structured retriever: stage one resolves (employer, plan, year, benefit line) by metadata precedence to the single source-of-record document, a filter rather than a similarity search; stage two ranks that document’s table chunks by descriptor and delivers the top two whole.
| Retrieval measurement (the stage report’s exact metric names) | Before | After |
|---|---|---|
| Document resolution — gold-family recall@2 (n=180) | 36.1% (global dense similarity) | 100% (structured key) |
| Table resolution within the resolved document — @1 / @2 (43 table questions) | 65.1% / 83.7% (dense over all chunks) | 93.0% / 100% (table-chunks-only ranking) |
| Gold-table recall@10, similarity-only ablation | 18.6% (baseline chunking) | 20.9% (table-aware chunking alone — flat) |
| Merged-table chunk contamination | 30.6% | 0.0% |
The ablation row is the order-of-operations finding: clean chunks are necessary but similarity still cannot rank the right table among near-duplicates; the structured key is the lever. The remaining knobs were re-confirmed null on the new index: the fusion-weight sweep peaked at 25.6% gold-table@10, the accept threshold had zero effect, the cross-encoder reranker added +2.3 pp, and the 4B embedder on a fair, instruction-prompted re-run scored 88.4%@1 against the 0.6B’s 93.0%@1 while costing ~6 GB of VRAM, so the existing embedder was retained. A confirmatory generation spot-check closed the loop: delivered context took the tabular slice from 18% to 83.3% (35/42), within 2.4 pp of the 85.7% hand-the-gold-table ceiling. Delivery recovered essentially the full prize.
Two residuals were carried forward. The replica’s exact-source-document recall reads 2.8% under precedence, a duplicate-family artifact of the synthetic corpus (on the one-source-per-key library, resolving the family is resolving the document; the Week-1 census confirmed it). And query understanding was recorded as an unbuilt dependency: the full structured key appears in question text 0% of the time (plan 31%, year 7%, benefit line 17%); in deployment the employer and plan join from the member record while the benefit line is inferred. F3 (Part I) plots the delivery story in these metric names.
The same stage closed three scope checks beyond the headline. The prose path was measured directly: retrieval given the resolved document reads 69%@1 / 86%@2 / 100%@10 on prose questions, with no regression from the re-chunk. Access control holds at the retrieval layer by construction: 0 of 180 deliveries crossed an employer boundary, because the structured key resolves within the asker’s scope before any ranking happens. And supersession exposure was sized: 37% of the table questions’ source documents carry amendments, and the amendments are entirely prose, so a minimal precedence scaffold shipped at this stage at zero test-set cost, with substantive amendment handling scheduled for the phase that could validate it.
5.2 Model capacity — re-asked after delivery was fixed (IV-3)
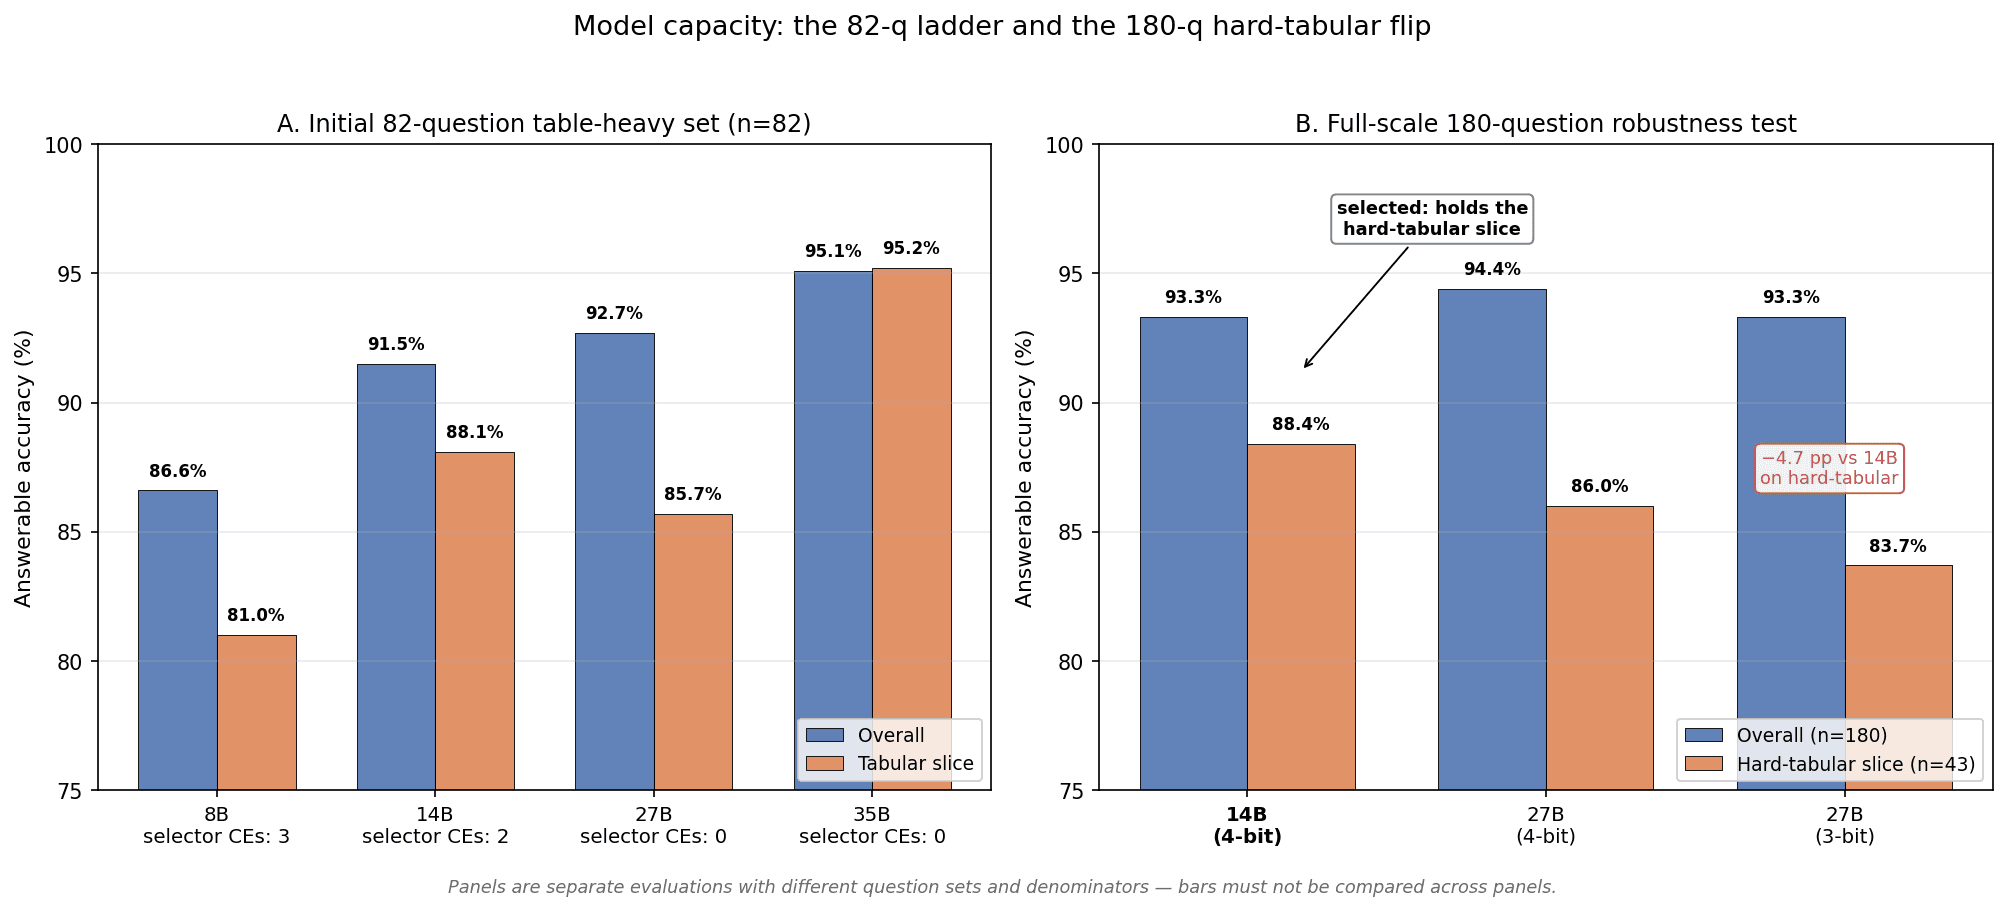
Phase 1 had measured capacity as a null. With delivery fixed, the question was re-opened from scratch, and the answer reversed. On the 82-question table-heavy evaluation, accuracy climbed cleanly with size (8B 86.6%, 14B 91.5%, 27B 92.7%, 35B 95.1%) and safety climbed with it: confident-wrong answers fell 11 → 7 → 4 → 4. A second capability threshold appeared in the selector role (the model-as-judge that would gate auto-accept if a model played that part): the two smaller models took 3 and 2 critical errors as cell selectors, the two larger took zero. That threshold is immaterial to the generator choice, since the deterministic spine is the gate (§5.3), but it is decisive for anyone tempted to let a mid-size model approve its own answers.
The constraint was the single GPU card, which the retrieval/scoring stack already occupies 6.7 GB of. The 35B fills the card by itself; expert offload fits it co-resident only at roughly 9 s/query; and the one 27B-class configuration that genuinely co-resided required an aggressive 3-bit quantization. That 3-bit 27B looked best on the 82-question sample; the full-scale 180-question robustness re-test overturned it, a reversal flagged against its own earlier pick. The 14B tied it on overall accuracy (93.3% each) and beat it by 4.7 points on the hard 43-question tabular slice (88.4% vs 83.7%), while running faster (1.49 s vs 1.97 s) in a plain 4-bit, full-context configuration with no exotic flags. Aggressive quantization bites exactly the numeric cells this engagement existed to fix, and it bit the sparse mixture-of-experts ceiling model even harder than the dense one.
That head-to-head yielded a reusable engineering rule, recorded for future hardware decisions: the 35B mixture-of-experts carries the highest full-precision ceiling in the ladder, yet at the 3-bit quantization that single-card co-residence demands it fell roughly five points, landing below the dense 27B, which lost nothing at all on the same evaluation. A sparse model activates only a few billion parameters per token, leaving fewer effective weights to absorb quantization noise; a higher ceiling does not survive the quant required to fit it.
Selection: the 14B dense model, 4-bit quantization, 16K context, co-resident with the full retrieval stack at 21.9 of 24.6 GB, ~1.5 s/query. The documented menu kept the options honest: the 8B as the conservative floor with the most headroom, and the 35B on a second consumer GPU as the optional quality ceiling, neither required for any committed number. The recorded lesson: small samples flatter aggressive configurations; validate the candidate at full scale, on the hard slice, before committing.
5.3 Typed extraction — the commitment layer (IV-4)
The work item said adapter retraining. The evidence said the adapter was inert on accuracy (Cohen’s d −0.021) and that its one contribution, citation-first formatting, was replicable in deterministic code at 100%. So the work shipped as typed extraction instead, documented as a change order recording the rationale.
The spine’s mechanics, end to end in code: parse the delivered tables into grids of row labels × column headers; match the question to a row (lexical + embedding, carrying a top-1-vs-top-2 selection margin) and a column (distinctive-qualifier, single-value-column, or value-agreement); read grid[row][column] verbatim; accept only if the answer is a single cell ∧ the row resolved ∧ the column resolved ∧ the value type matches the question’s stated form ∧ the value is concrete; otherwise abstain and route to a person with the source attached. A deterministic renderer then produces the citation-first answer and compliance footer — the adapter’s old job, now auditable, at 100%.
| Mechanism (43-question tabular census, table-aware index) | Coverage | Precision | Critical errors |
|---|---|---|---|
| Baseline-style generate-then-ground | 56% | 88% | 3 |
| Deterministic spine (model-free) | 30% (13/43) | 100% | 0 |
| 14B answerable-router arm | 37% (16/43) | 94% | 1 |
The ingestion surfaced exactly one critical error during development: a coinsurance-percentage question whose document also carried a flat-copay row for the same service, where treating money and percent as interchangeable let the wrong-form cell through. A strict-form type gate (when the question names the form, require an exact type match) closed it, restoring zero. The 14B arm recovers a few abstained cells but took one critical error of its own on a question the spine had right — the selector-safety threshold of §5.2 reproduced on the production base, and the reason the deterministic spine, not model judgment, is the committable gate (the model arm is coverage extension only, and was not deployed as the gate). On the single-cell numeric subset, extraction read 83% correct against generation’s 72%.
Integrated across the full set at this stage (still oracle-routed; production routing is §5.6), the system measured 82.2% → 95.0% answerable at the peak build (171/180), with benefit lookup at 76.2% → 94.3%. The net is +23: 27 baseline misses fixed, 4 regressions (one member-identity roster lookup the table path does not serve plus three computed/rule prose questions), each characterized individually. F7 (Part I) plots the census comparison.
Two more results round out the stage. All 13 auto-accepted answers sat in the top confidence bucket of the margin-derived calibration at 100% accuracy: the per-category calibrated-confidence mechanism demonstrated, with corpus-scale calibration scheduled for where the data to support it exists (§5.4). And the deterministic renderer measured 100% citation-first formatting with the required compliance footer on the accepted set, against the adapter’s measured 80–92%, verifying the change order’s claim.
5.4 The confidence rebuild — an honest null (IV-5)
The rebuild validated its feature thesis and then reported itself unnecessary. The structural gap was real: answer-text-only features rank the post-improvement residual at or below chance (leave-one-out AUC 0.30), while production-observable retrieval-quality and provenance features lift it to 0.58, a paired ablation gain of +0.28 with a 95% CI of [0.02, 0.58] excluding zero, with coefficients that read sensibly (citation adherence +0.86 and retrieval score +0.55 toward correct; value-similar family size −0.47 and amendment-in-play −0.35 toward error).
But the spine had starved the ranker. After §5.3 the system is 95.0% accurate at the peak build, leaving nine confident errors in 180; on nine negatives, absolute discrimination is statistically indistinguishable from chance (LOO-AUC 0.58, 95% CI [0.35, 0.79], containing 0.5) and the model does not beat a constant base-rate predictor on calibration (Brier 0.053 vs 0.048). Per-category calibration is negative-starved: only benefit lookup carries enough errors (7) to calibrate at all, the learned ranking there is at chance (0.49), and its zero-critical-error frontier computes to 1.6%, negligible against the spine’s 30%. The conclusion was reported as a finding: the committable auto-accept gate is the deterministic spine, unambiguously; the learned model’s durable value is the validated feature framework and the per-category calibration mechanism, positioned to earn discrimination at corpus scale where negatives densify. The confidence model got harder precisely because the system got more accurate.
5.5 Ingestion fidelity — the vision-model path (IV-6)
The spine guarantees correct selection, not cell fidelity: if the ingested text is already corrupted, the spine reads the corruption verbatim. This is the one place zero-critical-error is not protected by construction, and the binding dependency for auto-accept coverage on a document library roughly 30% scanned and about 10% degraded. Measured on the 11-question single-cell census: character-level OCR at light degradation produced 2 of 11 confidently wrong reads (a 75-dollar copay transcribed as “7S”, a 50-dollar copay transcribed as “l0% after deductible”), and an independent re-draw on a different seed produced four confidently wrong reads across its light and heavy conditions, so the failure is seed-robust, not an unlucky draw. Structure-destroying degradation is comparatively benign (the grid fails to parse, the spine abstains, coverage drops safely); character-level noise is the silent killer, because a corrupted value still looks type-valid.
The recovery path reads the image instead of the extracted text: render each delivered grid to a realistic table image; degrade it across an 11-condition scan-robustness sweep (a clean control; realistic photocopy chains at three severities; isolated blur, noise, JPEG, and low-resolution stressors; skew, ink bleed-through, and harsh binarization); have an 8B-parameter vision-language model transcribe it back under a verbatim-or-“[illegible]” instruction (never guess, never autocorrect); then run the identical spine. The result: zero confidently wrong reads across all ten degraded conditions, with each cell character-OCR corrupts read correctly in 10 of 10 degraded conditions, and the single imperfect case a safe abstain (bleed-through rendered one cell as a placeholder, which the spine’s concreteness gate refused). The vision model fits the same single card (bf16, ~17.5 GB, ~6 s/table), so ingestion needs no second GPU either.
The boundary was stated at the time: this is synthetic degradation of rendered clean replica tables, a validated mechanism rather than a corpus coverage claim, and it did not move the held auto-accept prediction. Phase 3 is where the mechanism met the production library, recovering the 162 scanned documents behind the corpus validating run (§7).
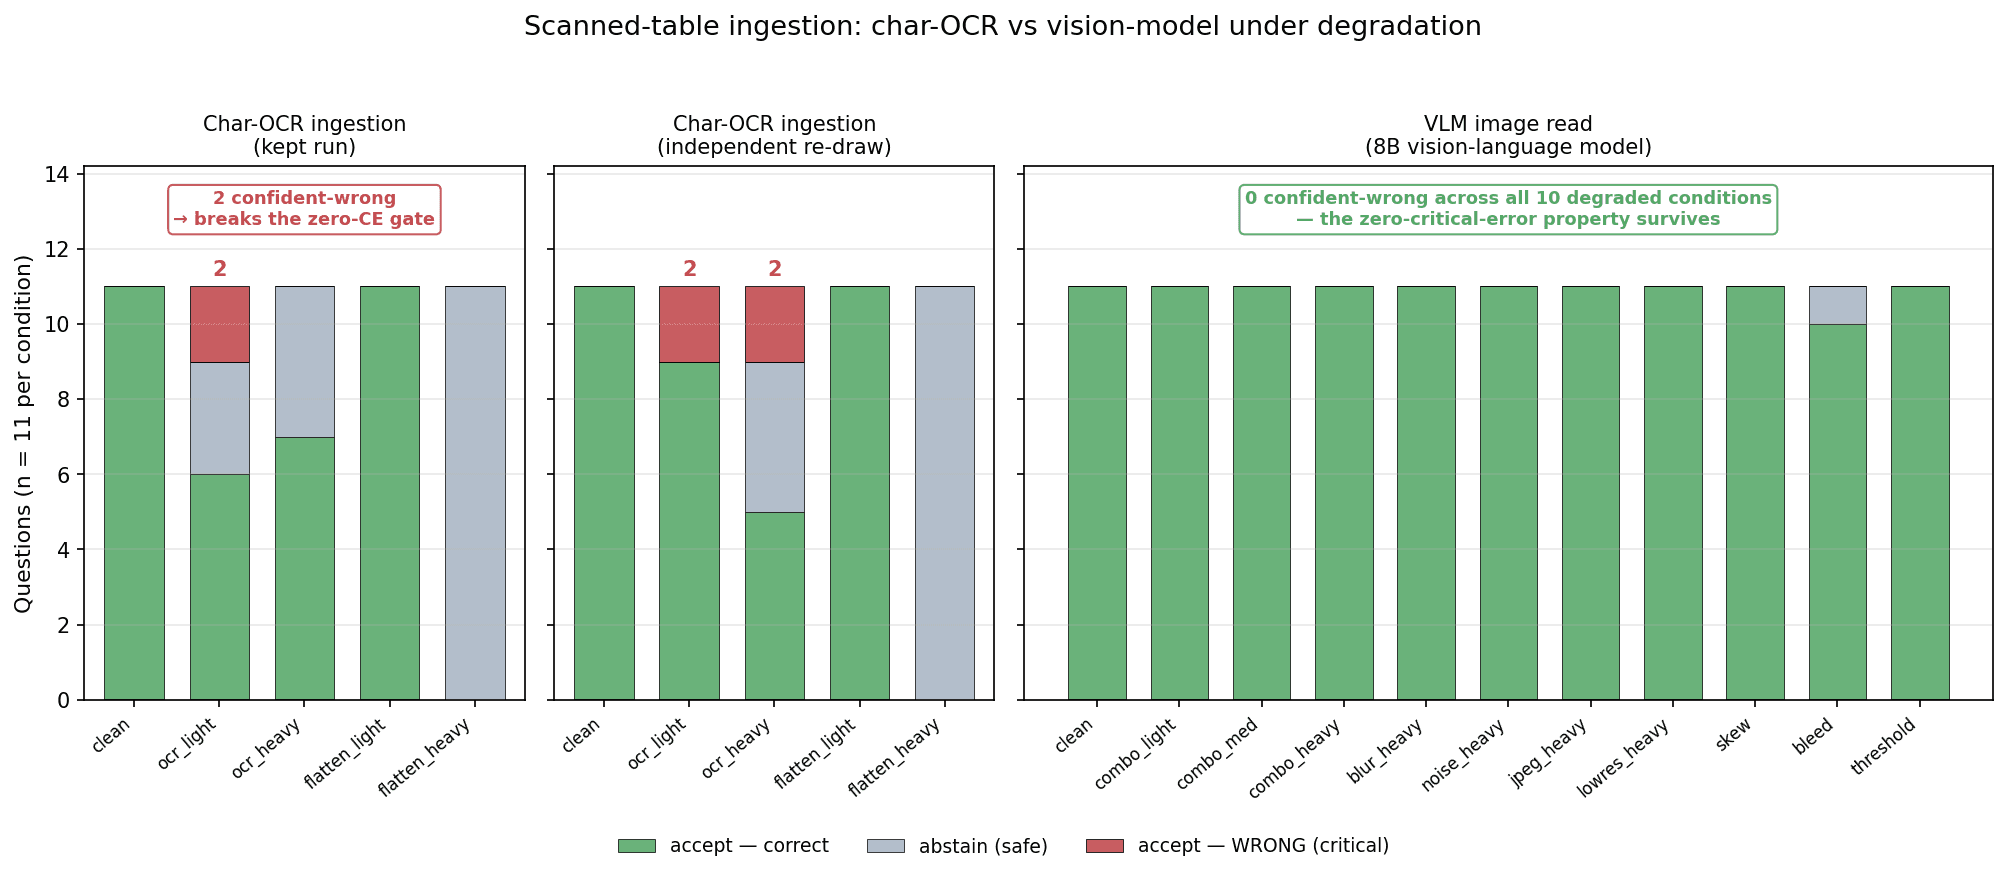
5.6 The router — removing the last oracle (IV-7)
Every integrated number through §5.3 routed questions to the spine or the generator using an oracle that inspected the gold answer’s source passage — legitimate for isolating components, impossible in production. IV-7 therefore rebuilt routing from production signals only: resolve the structured key, score the question against the resolved document’s table descriptors, and route to the spine iff the top descriptor cosine clears a threshold chosen on the router’s own precision/recall curve, never on system accuracy.
The router itself is mediocre, and the report said so: F1 0.59 at the optimal threshold (precision 0.47, recall 0.79), below the 0.72 the same design had scored on the old index, ironically because the ingestion fix produces clean, isolated descriptors that make benefit questions answered in prose look like benefit-table questions. And it does not matter:
| System (n=180, identical scorer) | Answerable accuracy |
|---|---|
| Baseline | 82.2% (148/180) |
| Improved — gold-free router | 95.0% peak (171/180), CI [90.8%, 97.3%] |
| Control — oracle router | 95.0% — router cost vs oracle: +0.0 pp |
The error decomposition is the finding. Of 38 false-positive routes (prose questions sent to the spine), the spine abstained on 37, and the one it accepted was correct: zero critical errors, zero accuracy lost. Of 9 false negatives (tabular questions sent to generation), the generator still answered 8 of 9 correctly: zero accuracy lost, two auto-accepts forgone (cosines 0.518 and 0.529, just under the threshold; both recovered at a lower threshold at no critical-error cost). Auto-accept under the router: 6.7% of answerable (12/180) at 100% precision and 0 critical errors, versus 7.2% (13/180) under the oracle and 30% of the 43-question tabular census — one zero-critical-error property, three denominators, never blended. The headline is threshold-robust (the peak 95.0% and 0 critical errors at every τ from 0.50 to 0.65), and 0 of 20 adversarial questions routed to the spine at any setting. Conclusion: the deterministic spine, not the router, is the safety gate; the router is triage, to be tuned for recall in production where the spine makes false positives free.
Two boundary notes. The descriptor-cosine signal is real but overlapping (tabular questions median 0.614 against prose 0.354), and the false positives are not noise: every one carries a benefit line, and 21 of the 38 are benefit-lookup questions whose answers happen to live in prose. No gold-free signal short of reading the answer separates “benefit, answered in a table” from “benefit, answered in prose,” which is why router precision is structurally capped and the spine has to be the gate. And the all-200 secondary number (79.0% → 90.5%) conservatively inherits the baseline’s behavior on the 20 unanswerable questions, because this recombination did not re-measure the generative refusal path; under the all-200 accuracy label that behavior credits 10 of the 20, a stricter standard than the refusal-detection instrument, whose figures (90.0% baseline, 95.0% improved) are measured and reported separately (§2.4).
5.7 Attribution — where the lift comes from (IV-8)
| Stage (cumulative, n=180, identical scorer) | Answerable accuracy | Increment |
|---|---|---|
| Baseline system | 82.2% (148/180) | — |
| + structured retrieval + 14B capacity | 95.0% (171/180) — already the peak-build level | +12.8 pp |
| + typed-extraction spine | 95.0% (peak, unchanged) | +0.0 pp |
| + router | 95.0% peak, CI [90.8%, 97.3%] | +0.0 pp |
The entire accuracy lift is retrieval plus model capacity; the spine and the router add zero points. That is the architecture’s division of labor: the spine auto-accepts exactly the clean cases the capable reader already gets right, converting accuracy that exists into answers that can be committed (deterministic, citation-first, zero-critical-error) — a different property, earned by a different component, and reported separately throughout this engagement. The attribution also explains the program’s two nulls: the confidence model sat at chance (§5.4) and the router’s F1 was harmless (§5.6) because the accuracy was banked upstream, where it is least fragile. One method note: the split within the retrieval+capacity bundle is cross-referenced from §5.2’s isolated measurements rather than re-run end-to-end, and is recorded as such.
The lift was broad: every category, difficulty band, and tier improved or held — benefit lookup +18.1 pp (76.2% → 94.3%), the weakest baseline band (difficulty 2) +17.0 pp (73.2% → 90.2%), the deliberately hard edge-case tier +12.5 pp (85.0% → 97.5%) — and no slice regressed. The blended results carry two flags taken up next: automated-NLI faithfulness reads 93.3% on the peak build, below the ≥95% committed bar (the diagnosis, the lever sweep, and the recorded election are §6), and hallucination reads 1.7% against a 0.0% baseline, a regression confined to the generative path, with the auto-accept path at 0.0% by construction. F5 and F6 (Part I) plot the category lift and the attribution waterfall.
6. The Faithfulness Trade-off and the Election
One committed prediction tracked below its bar on the automated scorer, and what followed (diagnose the miss, attack the diagnosis, sweep every alternative, route the decision before the gate, record the recommendation and the election separately) is the engagement’s governance model compressed into a single metric. Part I tells this story in narrative form (“The Metric Trade-off and Configuration Selection”) and F8, embedded there, plots the frontier; this section is the technical record behind both.
6.1 The 93.3% reading and its diagnosis
Citation faithfulness was a committed prediction at ≥95% on the automated NLI scorer, a maintain bar registered against the baseline’s 96.1%. The peak build read 93.3% blended. The gap sits entirely on the generative path: the auto-accept path is 100% faithful by construction (it reads the cell verbatim and renders citation-first), while the 168 generated answers scored 92.9%, twelve answers flagged unfaithful.
The twelve decompose into two clusters. About nine are correct, properly grounded benefit values restated in prose: their answer-to-passage lexical overlap is 0.08–0.15 (a clean sentence scored against a markdown table), and their NLI adherence lands at 0.49–0.70, just under the 0.70 faithfulness threshold. About three are genuine: one outright wrong answer, the others conflicts. So roughly three-quarters of the measured “faithfulness loss” is the scorer failing to align a correct table-to-prose paraphrase, not the system asserting something its source does not support.
“The scorer is wrong” is what every vendor says about a missed metric, so the diagnosis was pressure-tested against its obvious rival before anyone was asked to accept it. The natural suspect was the compliance footer: boilerplate appended to 99% of answers, plausibly read by an NLI model as unsupported claims. The hypothesis was tested directly and refuted: stripping the footer before scoring made automated faithfulness worse, 93.3% → 91.7%, and pushed measured hallucination from 1.7% to 3.9%; the scorer already handles the footer, and removing it leaves only the substantive borderline claims. (That 91.7% is a faithfulness reading on the assessment corpus; it is numerically coincidental with, and must never be conflated with, the 91.7% raw corpus accuracy of §7.1.) The artifact diagnosis survived because the refutation was attempted first.
6.2 The lever, and the sweep that proved the trade irreducible
A viable lever existed: instruct the model to quote the grounding value verbatim before explaining, the generative analog of what the deterministic renderer already does on the auto-accept path. Applied through the production router, it lifts automated faithfulness over the bar. It is not free, and the deployable-policy sweep below is the evidence the decision was made on:
| Generation policy (n=180, identical scorer) | Answerable accuracy | Automated faithfulness | Deployable? |
|---|---|---|---|
| Standard generation — the peak build (Option A) | 95.0% | 93.3% | Yes |
| Global extractive — the lever on every answer | 93.3% | 95.6% | Yes |
| Router-gated extractive — the balanced build (Option B) | 94.4% | 95.6% | Yes |
| Selective via the gold tabular label (oracle reference) | 95.0% | 95.6% | No — requires hindsight the live system does not have |
| Router-gated variants engineered to recover peak accuracy (three tested) | 95.0% | 93.3% | Yes — and the faithfulness gain is lost |
The sweep’s recorded verdict: no deployable policy reaches the peak build’s accuracy and the ≥95% automated-faithfulness bar simultaneously. The lever fixes four flagged questions and breaks exactly one: Q-012, a health-savings-account contribution question whose correct answer is a computed total. Verbatim quoting makes the model quote the two source cells faithfully and drop the sum — the one number the member actually needs — turning a correct answer into an incomplete one. And those five questions are indistinguishable on every signal the live system can see: the same computed-multipart question class, the same spine confidence, overlapping router cosines. No deployable rule keeps the four fixes without taking the one break, and the oracle row needs the gold “this was a table question” label that production does not have. Option B therefore trades one, member-facing regression (caught by the verification mandate) to clear what §6.1 shows is substantially a scorer artifact.
6.3 Routed before the gate; recommended; elected
Before the second gate, the entire picture was considered: the reading, the diagnosis, the refuted footer hypothesis, both validated configurations with their exact costs, the irreducibility sweep, and a recommendation. The routing mattered as much as the content: a committed metric tracking below target reached an analysis with options while there was still time to think, not as a slide in the gate room (§2.2).
| Option | Accuracy | Faithfulness — automated NLI | Faithfulness — human re-rating (the adjudication mechanism Option A proposed under the registered methodology) | Introduces a member-facing error? |
|---|---|---|---|---|
| A — keep standard generation | 95.0% peak | 93.3%, below the bar | expected ≥95% (the gap is correct paraphrase) | No |
| B — adopt the router-gated lever (the balanced build) | 94.4% | 95.6%, clears outright | ≥95% | Yes — one (Q-012) |
At the gate, Option B was selected, the balanced build at 94.4% accuracy / 95.6% automated faithfulness, on defensibility grounds: a configuration that meets every committed bar on the scorer that runs on every build is defensible to an auditor in one sentence, and the six-tenths of a point it costs is caught by the verification workflow that runs anyway. Both positions, the recommendation and the election, were recorded in the gate decision with their reasons.
Three attachments made the elected configuration safer than it had been an hour earlier: the regressed computed-total question went onto the Phase-3 work list as a refinement (condition C-2); a one-time human re-rating was retained as corroboration, filed alongside the automated number, not as the pass dependency (condition C-3); and the recommendation-versus-election record itself (condition C-1).
6.4 The recovery
The refinement then closed the gap from the other side. Midway through Phase 3, C-2 taught the extraction path to distinguish a single-cell read from a computed total, recovering Q-012 without reopening the faithfulness exposure. The production build moved to 94.8% accuracy / 95.5% automated faithfulness, the deployed configuration, measured at acceptance on the expanded 300-question production instrument (§8.2) — effectively the peak build’s accuracy with the committed faithfulness bar clearing outright on the scorer of record. The human re-rating ran on the sample aligned with the automated pass. On F8’s frontier (Part I), the deployed point sits where the gate-week sweep said no deployable configuration could yet reach, moved there by engineering the one question that forced the trade (and read on the acceptance instrument rather than the pilot one).
7. Productionization and Operations (Phase 3)
Phase 3’s job was to make the measured result a system that could run: transfer the numbers to the corpus, and build the production path and its compliance controls. It ran against the conditions register of §2.2, with the only incident landing in the middle of it, handled by logic built for exactly that event.
7.1 The corpus validating run (A-1)
The first Phase-3 work — ahead of any production build — was the validating run the second gate had made a condition: re-run the deployed before/after against the full production document library and re-score all nine predictions, on thresholds defined before the run. This was the engagement’s #1 caveat (§2.5) being retired on the data that mattered.
| Corpus validating run — production library, deployed balanced build | Answerable accuracy | Automated faithfulness |
|---|---|---|
| Raw ingestion — 162 scanned documents (~18% of the plan-document library) below the char-OCR legibility threshold | 91.7% | — |
| After vision-model recovery of the scanned stock | 94.2% | 95.4% |
| Replica reference — the elected balanced build of §6 | 94.4% | 95.6% |
The raw read was reported as exactly that, with its cause: 162 scanned plan documents, about 18% of the plan-document library, had been ingested below the character-OCR legibility threshold. This was the failure class the assessment had stress-tested (§4.4), the Week-1 fidelity check had held auto-accept for (§2.3), and IV-6 had built the recovery for on synthetic degradation with the explicit boundary that coverage would be measured here (§5.5). The vision-model path re-read the 162 documents’ tables from images, and the validating run landed within noise of the replica result, with the zero-critical-error auto-accept property surviving on data (~30% of the tabular slice, 0 critical errors). Both numbers, raw and recovered, went in the status report with the mechanism in between.
The evaluation instrument also grew here: ~100 additional questions, stratified to the same category mix, de-duplicated against the original set by embedding similarity, gold answers agreed, inter-annotator agreement κ ≈ 0.79 on a sample. The expanded 300-question set re-confirmed the result and became the acceptance instrument for the third gate (§8.2).
7.2 The production build, and the one incident
The production stand-up followed: cutover early in the phase (production document-store and wiki wiring, finalized ACLs, live ingest webhooks), and a CI/CD pipeline whose stages are the engagement’s controls expressed as code (lint → unit tests → the ACL compliance harness → a PII-detection regression → integration → staging → acceptance → a 10% canary with automated rollback), with every promotion requiring a promoter, and rollback a single feature-flag change to the prior approved artifact. The C-2 refinement (§6.4) and the router recall-tuning (condition A-4) were promoted through exactly this path.
The incident: midway through the phase, under sustained load, the canary node (the 10% of traffic running the newest build) exhausted GPU memory and stopped completing requests. The automated rollback tripped as designed and returned that traffic to the stable build inside three minutes; the request logs confirmed zero visible impact. The incident was classified at the highest severity on detection, the worst plausible read of a GPU out-of-memory, then reclassified one step down, with the reasons stated: rollback confirmed, affect would be on the canary node only, no compliance, data-loss, or availability dimension. Closed with the fix promoted through the same canary it had tripped.
The root cause was the engagement’s own Phase 2 finding meeting production concurrency: KV-cache growth under concurrent traffic pushed resident VRAM past the single card’s envelope, the headroom limit IV-3 had characterized in the lab (§5.2). The fix was a concurrency cap plus a KV-cache budget keeping resident VRAM under the card’s dedicated envelope; the durable part was a new VRAM-headroom alert wired into monitoring, turning a characterized limit into an enforced one. When the sponsor asked the question the incident begged (is the single card undersized?), the answer was no: with the cap in place the one card carries the committed load with headroom, and the second-card option stayed exactly where the gate had left it, a backlog item triggered only if the deferred endurance measurement shows a shortfall (§8.2). The failure mode did not recur for the remainder of the engagement.
7.3 The compliance surface
The P-1 answer-scrub — the hard gate. The answer-level PII scrub and input-redaction controls had been converted at the second gate from “demonstrated at DG2” into a hard pre-go-live condition, written into both the condition register and the SOW’s go-live criteria: no member answer reaches production until Compliance accepts the controls. They were built into the production answer path during Phase 3, measured at 99.7% detection recall against a ≥99.5% bar on a fresh ~200-query holdout (the single miss: a partial identifier embedded inside a longer plan code, the residual pattern already characterized and accepted), and accepted in the gate run-up. The date stood because the control was ready. Per-category recall on the free-text identifier classes was delivered alongside, with confidence intervals and a secondary detector on 100% of log writes (condition P-2); the per-category floor refused at the first gate stayed refused, with the measured-residual-with-CI structure serving in its place.
Access control, at three distinct scopes, kept distinct because they are different instruments:
| ACL evidence | Result |
|---|---|
| Baseline evaluation probes (n=200, §3.2) | 0 violations |
| Pilot isolation harness + the 180-question evaluation (§5.1) | 31/31 tenant-isolation cases; 0 cross-employer deliveries |
| Phase-3 production harness + acceptance-window shadow traffic | 0 violations across 4,000 synthetic-permission queries spanning the permission space, plus 2,813 shadow-mode queries — clean |
The ACL-failure alert is the monitoring stack’s zero-tolerance page.
The audit posture. The SOC 2 control-mapping evidence pack, accepted in the gate run-up, maps the system into the SOC 2 Type II control catalog instead of standing up a parallel framework, across security, availability, processing integrity, confidentiality, and privacy; a cross-reference index ties each control to its corresponding privacy-regulation citation so one set of evidence serves both assessors. Underneath it: a searchable audit store carrying every query, retrieval, answer, refusal, and feedback event at seven-year retention with a PII pre-scrub on the searchable record; the un-redacted log encrypted with dual-control decryption; and random-sample audits of the searchable log returning zero protected or personally identifying tokens. The corroborating human re-rating of §6.4 is filed in the same pack, alongside the automated number.
7.4 Operations hardening
The disaster-recovery drill ran late in the phase against the warm-standby host, initiated from the worst realistic state: a staging run was in progress on the standby (its designed dual-use posture), so the cutover began with the teardown step a clean-lab drill would skip.
| Cutover step | Duration |
|---|---|
| Staging teardown — the dual-use posture exercised | ~2 min |
| Image and release-tag sync, integrity verification, model load into VRAM | ~55 min |
| Production-standby stack up; all eight containers healthy | ~25 min |
| Bot-channel repoint and endpoint propagation | ~36 min |
| Audit-store reconnect; buffered-write replay; recovery-point check | ~20 min |
| Full smoke suite — auth, ACL, retrieval, extraction, generation, verification, audit write | ~30 min |
| End to end | 2 h 48 m, inside the 4-hour recovery-time objective |
The one-hour recovery-point objective was met via the hourly-incremental backup and buffered-write replay. The drill’s product was its deviations, both small and both fixed: the standby’s pre-pulled images were two release tags behind (the pre-pull cadence is now kept within one tag of production), and one manual endpoint-update step was missing from the runbook page (added). The largest single contributor, the ~55-minute image sync and model load, is explained in the drill report and has an identified lever, which is what makes the next cutover faster than this one.
Monitoring ships as 15 production metrics: seven per-query (per-stage latency including the route and typed-extraction stages, retrieved-document provenance, the model/config version that served the answer, which path the answer took and its selection margin, outcome, hashed identity, feedback) and eight daily aggregations (volume, rating distribution, the fallback-to-manual-search rate as the adoption signal, a rolling 7-day flagged-incorrect rate as the quality signal, cache hits, queue waits, load failures, PII-pipeline errors). 9 alert rules sit on top: ACL failure and PII-pipeline error as zero-tolerance critical pages, model/config load failure blocking any promotion, quality-degradation, volume-anomaly, latency, queue-wait, and cache-health rules, and the ninth: the VRAM-headroom early warning the canary incident created.
7.5 The deployed topology
Eight containers on the single existing GPU, co-resident at a measured ~93% VRAM capacity; the remaining headroom is the budget the ninth alert protects.
| Container | Role |
|---|---|
| Orchestrator | The workflow DAG; hosts the typed extractor and the deterministic citation-first renderer |
| Generator | 14B-parameter open-weights LLM, 4-bit quantized, 16K context — no adapter (§5.3) |
| Embedder | 0.6B-parameter embedding model — the 6.7×-larger alternative measured null on a fair re-run (§5.1) |
| NLI verifier | Entailment-model faithfulness check on every surfaced answer |
| Audit writer | Buffered write path to the audit store; runs the PII pre-scrub before any searchable write |
| Chat bot | Translates chat-platform events into workflow requests; SSO against the identity provider |
| Ingestion | Webhooks plus nightly reconciliation; table-aware chunking and descriptor tagging; invokes the vision reader during reindex windows |
| Cache / queue | Response cache keyed by query and permission snapshot (so a cached answer cannot leak across ACL scopes); capacity queue; audit-write buffer |
The vision-model table reader (~17.5 GB) cannot co-reside with the serving stack and does not need to: it runs as an on-demand ingestion-time model during reindex and reconciliation windows, time-sharing the GPU; it is not a ninth persistent container, and not a second card. Appendix B carries the full deployed-stack reference card.
8. Decision-Gate Outcomes and Pre-Registered Predictions
8.1 Three gates, three outcomes
| Gate | Engagement point | The question before the room | Outcome |
|---|---|---|---|
| DG1 | Close of the assessment | Is the diagnosis right, and is the improvement path worth continuing past a clean audit-only exit? | GO with conditions — 13 registered; the commercial envelope set; the build time budget re-tranched behind the Week-1 validation |
| DG2 | Close of the improvement pilot | Does the measured result justify productionizing, and in which configuration? | GO with conditions — 16, plus a recorded frontline concurrence; the §6 election recorded with both positions; the Phase-3 SOW executed |
| DG3 | Close of productionization | Is the deployed system acceptable for production? | ACCEPT at 19 of 20 criteria — the remaining criterion deferred; auto-accept graduated for exactly one category |
By the third gate, every prior condition was either discharged in evidence or carried forward explicitly: the redaction control accepted (§7.3), the C-2 refinement deployed (§6.4), the corroborating re-rating filed.
8.2 The third gate in detail
The twenty acceptance criteria were fixed in advance, at the production threshold, and scored in the open; the documentation carries all twenty with their measurements. The acceptance window itself ran as a shadow-mode deployment (2,813 questions answered in parallel with the existing workflow, reversible at any moment), the same pattern that governs every future model change. The bars:
| Criterion (selected from the twenty) | Bar | Measured |
|---|---|---|
| Answer accuracy — expanded 300-question blind set | ≥ 85% | 94.8% deployed |
| Citation faithfulness — automated NLI | ≥ 95% | 95.5% deployed; the human re-rating corroborates (§6.4) |
| Hallucination | ≤ 2% | 1.7% — production bar (the registered prediction was ≤ 3%) |
| Adversarial refusal | ≥ 90% | 95.0%; none of the 20 baits reached auto-accept |
| Auto-accept at zero critical errors | ≥ 25% of the tabular slice | ~30%, 0 critical errors across the four-week record |
| Production latency | p50 ≤ 4 s; p95 ≤ 10 s | 3.6 s; 9.1 s — full-pipeline measurements, a different instrument from the pilot’s per-query generation timing |
| Document-level ACL | 100% | 100% — the §7.3 harness and shadow evidence |
| PII detection recall | ≥ 99.5% | 99.7% on the fresh compliance-built holdout |
| Prompt-injection defense | ≥ 95% on the attack corpus | 97.2% — the extraction path is schema-constrained (it can only emit a selected cell coordinate), so resistance is structural on the committed path |
| Peak-load burst | ≥ 3× baseline sustained 2 hours | 3.4× sustained 4 hours; no degradation, no GPU memory drift |
| Time-per-lookup reduction | ≥ 25% (the committed 25–30% band) | 26%, on calls |
| SOC 2 evidence pack; operations runbook | accepted | Both accepted in the gate run-up |
Two measurement notes traveled with the acceptance record. The shadow window’s traffic ran at roughly 563 questions per day, below the volume the discovery-period baseline projected, because the window coincided with a reduced call volume; the acceptance measurements are not volume-gated, but the note was filed so the first volume reading would be interpreted against the discovery baseline, not the acceptance-window rate. And where the criteria are tighter than the registered predictions, both bars were stated: hallucination, for example, was accepted at 1.7% against a ≤2% bar, inside the looser ≤3% bar the prediction had registered.
The deferred criterion — criterion 18, six weeks of sustained endurance at three times baseline load — was neither waved through nor failed. Phase 3’s synthetic-load budget could not honestly simulate six weeks of peak volume, so the criterion was deferred to the peak window itself: recorded in the gate decision, scheduled, and assigned a reporting date (the season-end review).
The gate run-up also produced the engagement’s most instructive small governance moment. RCTK found, in its own success-criteria baseline, a stale faithfulness bar of ≥97%: a clerical inheritance from the earlier build-from-scratch scoping that contradicted the ≥95% maintain bar actually registered in writing at kickoff and scored at the second gate. The correction was made toward the registered commitment and footnoted in the gate pre-read.
The third gate’s one decision was the auto-accept graduation, and it went with a deliberately narrow recommendation: graduate the single-cell benefit-lookup category, where the verification record showed zero critical errors, and keep everything else in assist mode.
8.3 The nine predictions, scored
Nine predictions were registered at the Phase-2 kickoff, tiered committed/stretch, to be scored at the gates pass-or-fail regardless of outcome (§2.3). The mid-engagement reading was reported in the same spirit: at the second gate the scorecard went out as five tracking-pass, one at-risk (faithfulness, §6), one held (auto-accept, then at its fourth hold), and two deferred-by-design (the protected-information control, built before go-live by condition; time savings, measurable only on calls) — not as “all on track.”
| # | Prediction (registered bar) | Tier | Final outcome |
|---|---|---|---|
| P1 | Answer accuracy ≥ 85% | Committed | PASS — 95.0% peak validated build; 94.8% deployed |
| P2 | Citation faithfulness ≥ 95% | Committed | PASS — 95.6% elected → 95.5% deployed on the automated scorer; the peak build’s 93.3% automated reading diagnosed in §6; the election recorded; human re-rating retained as corroboration |
| P3 | Hallucination ≤ 3% | Committed | PASS — 1.7%, generative path only; the auto-accept path holds 0.0% |
| P4 | Document-level ACL 100% | Committed | PASS — zero violations at every scope measured (§7.3) |
| P5 | Adversarial refusal ≥ 90% | Committed | PASS — 95.0%; none of the 20 adversarial questions ever reached the auto-accept path |
| P6 | No new net exposure of protected member information | Committed (engineered control) | PASS — the P-1 scrub built, validated, and Compliance-accepted before any exposure (§7.3) |
| P7 | Prose-answer quality ≥ 93.5% | Committed | PASS — 96.6% on the non-table categories |
| P8 | Auto-accept ≥ 25% at zero critical errors | Stretch — held five times | HELD property committed — zero critical errors everywhere measured, including ~1,100 auto-accepts; ~30% of the tabular census on clean tables; volume coverage graduated by category on evidence |
| P9 | Time-per-lookup reduction ≥ 25–30% | Committed (promoted at Week 1) | PASS — ~26% measured at the third gate, inside the committed band |
Nine predictions registered before any pilot data existed, scored at the gates regardless of outcome: eight committed predictions passed. The one stretch prediction was partially achieved: the zero-observed-critical-error condition held, while coverage was graduated only for a restricted category. The rows that make the scorecard credible are the imperfect ones: citation faithfulness (P2) passed in the deployed balanced build through an election rather than on the peak build’s automated reading, and auto-accept (P8) finished as a committed zero-critical-error property with category-by-category graduation. The discipline that produced the clean sweep (register early, promote only on evidence, score regardless) is the reusable deliverable.
Nine of nine finished on the right side of their registered bars.
9. Production Results — The First Support Cycle
The engagement’s numbers were measured one more time. The first support period ran under load ramping, measured by telemetry plus a 150-query audited gold-label sample. The table below sets the period against the committed bars.
| First support period | Measured | Reference |
|---|---|---|
| Answerable accuracy (150-query audited sample) | 94.7% | 94.8% deployed — within sampling noise |
| Automated faithfulness (audited sample) | 95.4% | ≥95% committed; 95.5% deployed |
| Auto-accepts — graduated single-cell benefit-lookup category | ~1,100 at 0 critical errors | The zero-critical-error property |
| Flagged answers | 1.9% — majority correct-but-terse or known edge cases; the three flagged auto-accepts all correct on review | No new error class |
| PII answer-scrub | ~99.7% recall; zero member exposures | ≥99.5% bar (§7.3) |
| Document-level ACL | 100% — the scope validated | Zero-tolerance |
| Production latency | p50 ~3.1 s · p95 ~8.4 s | Within the third gate’s ≤4 s / ≤10 s production bars (§8.2) |
| Peak throughput | ~118 queries/hour at the volume ramp | Under 6% of the measured single-card ceiling (~2,200/hour) |
| VRAM headroom | The ninth alert fired once, at the ramp’s first peak; the concurrency cap absorbed it | No incident; no second-GPU signal |
The period was also the deferred criterion-18 endurance window (§8.2): sustained throughput tracked comfortably above the 3× target (the single card runs at a small fraction of its measured ceiling even at the volume ramp), and the formal call still waits for the complete window.
The period exercised the machinery for the one constant in a benefits corpus: change. When three next-plan-year documents finalized, the twelve updated plan documents were re-ingested under the table-aware pipeline, the structured-key index was updated, and, the step that matters, the precedence layer was set to serve each new plan year and suppress its superseded predecessor through the renewal-overlap weeks when both legitimately coexist. The refresh was validated against the held-out evaluation sets retained for exactly this purpose: correct resolution on the updated documents, zero stale-version serves on the spot-check, no regression on the broader slice, and the auto-accept property preserved on the refreshed cells — then promoted via the warm standby with zero downtime.
And the support period summary carried one service item: a false-abstain pattern, the system declining a narrow class of multi-year deductible questions during the renewal overlap that a tightened precedence signal would let it answer safely. The failure is conservative, costing coverage, not safety; it was logged, sized, and routed to the improvement backlog and the period-end review. The support draw itself was light (roughly a third of the budgeted hours), the expected shape of a clean period: the support tier is sized for the volume peak.
10. Evidence Index
Per the anonymization terms of this study report, artifacts are cited by descriptive title only. Every quantitative claim in this report traces to one of the artifacts below; the figure-data file published alongside this report carries every plotted value with a pointer to its source.
(a) Engagement and governance documents
| Artifact | What it evidences here |
|---|---|
| Assessment and Phase-2 scoping plan (the DG1 deliverable, v2.0) | The diagnosis chain (§4.2), the ruled-out interventions (§4.3), the validated-path stress tests (§4.4), the surfaced finding (§4.5), the risk register and commercial protections (§2, §10) |
| Improvement evaluation report (the DG2 deliverable, v3.0) | The before/after and stage evidence (§§3–5), the prediction outcomes and faithfulness diagnosis (§6, §8.3) |
| Productionization and handoff document (the DG3 deliverable, v2.0) | The 20 acceptance criteria and measurements (§8.2), the deployed topology and operations detail (§7.5, Appendix B), the support election (§10) |
| The registered-predictions record (Phase-2 kickoff) | The nine predictions, tiers, and promotion log (§2.3, §8.3, Appendix A) |
| The faithfulness trade-off memo (pre-DG2) | The §6 options, recommendation, and pre-gate routing |
| The three gate-decision addenda (conditions registers and dispositions) | The 13 / 16 condition sets, the recorded election, the graduation terms, the condition dispositions (§8.1–§8.2) |
| The written status reports (three per build phase) and the canary-incident escalation record | The Phase-3 narrative of §7 — the validating run, the incident timeline and reclassification, the gate run-up — each reported in its own period |
| The two change orders (the scoped legacy-repository import; the method swap) | The §5.3 method-change rationale |
| The closeout records (administrative checklist; the first support summary) | The closeout, data-handling re-scope, and support mechanics; the §9 figures |
(b) Engineering stage reports
| Artifact | What it evidences here |
|---|---|
| Baseline benchmark report | The scorecard and configuration of §3 |
| Phase-1 preliminary test results | The component validations, stress tests, and the prototype’s honest range (§4.4) |
| The seven improvement-stage reports (retrieval; base-model evaluation; typed extraction; confidence rebuild; vision-model ingestion; end-to-end evaluation and router; improvement analysis) | The §5.1–§5.7 stage findings, in their authoritative form; each report is the interpreter of its own result data |
(c) Result data
| Artifact | What it evidences here |
|---|---|
| The baseline end-to-end evaluation results | The §3 scorecard, category table, and latency figures |
| The per-stage result files (recall sweeps; model-comparison cuts; the auto-accept census; the faithfulness diagnosis and lever-validation sweep; the ingestion-robustness tallies; the end-to-end and attribution analyses) | Every JSON-sourced number in §§4–6, including the §6.2 policy sweep and its recorded irreducibility verdict |
| The figure-data file accompanying this report | Every value plotted in F1–F11, each with provenance; the figures regenerate from this file alone |
(d) Figures
| ID | Title | Embedded at |
|---|---|---|
| F1 | Engagement timeline: three phases, three gates | Not embedded — the timeline is carried as T1 (§1) |
| F2 | Baseline answerable accuracy by category | Part I — Phase 1 (data also in §3.3) |
| F3 | Table delivery: before vs after the structured retriever | Part I — Phase 2 (metrics in §5.1) |
| F4 | Model capacity: the 82-question ladder and the 180-question hard-tabular flip | §5.2 |
| F5 | Answerable accuracy by category: before vs after | Part I — The Result (data also in §5.7) |
| F6 | Where the lift comes from (stage attribution) | Part I — The Result (table in §5.7) |
| F7 | Auto-accept on the tabular census: deterministic spine vs LLM router | Part I — The Commitment Layer (table in §5.3) |
| F8 | The accuracy–faithfulness frontier and the configuration election | Part I — The Metric Trade-off and Configuration Selection (analysis in §6) |
| F9 | The nine pre-registered predictions: outcomes | §8.3 |
| F10 | First support cycle vs committed bars | Not embedded — the data is the §9 table |
| F11 | Scanned-table ingestion: char-OCR vs vision-model under degradation | §5.5 |
A published copy of this study report carries this index in descriptive form only; the underlying artifacts remain internal to the engagement record.
Appendix A — The Pre-Registered Prediction Protocol
The protocol is the engagement’s accountability instrument, and it is simple enough to reuse:
- Register before data. The predictions are written down at kickoff, before any pilot data exists, with the exact thresholds the gates will score.
- Tier by evidence, not by optimism. Committed means the diagnostic evidence is in hand and a miss is a serious, reportable event carrying a root-cause analysis, with no after-the-fact reclassification. Stretch means a specific uncertainty remains and a miss is informational.
- Commit thresholds with margin, never points. Accuracy was committed at ≥85% with an expected landing around 90–91%, so ordinary measurement noise could not put the commitment itself at risk.
- Name each held prediction’s dependency. Auto-accept was held on scanned-table ingestion fidelity; time savings on the measured search-versus-read split. A hold with a stated dependency reads as engineering honesty; a vague hold reads as hedging.
- Promote only when the evidence arrives. One promotion per arrival, attributable to the evidence.
- Score everything at the gates, pass or fail, regardless of outcome. The scorecard is reported in whatever state it is in (§8.3’s mid-engagement reading: five tracking-pass, one at-risk, one held, two deferred-by-design).
The full promotion ledger is short: numbers moved rarely, and only on arrivals.
| Prediction | Registered as | What moved, and when |
|---|---|---|
| Answer accuracy | Stretch at the first gate | Promoted to committed at the kickoff, on the duplication read (the variable that had kept it stretch) and nothing else |
| Time-per-lookup reduction | Committed-contingent on the search/read split | The condition resolved at the Week-1 check (~63% of lookup time measured as search), activating the committed 25–30% band |
| Auto-accept | Stretch | Never promoted — held five times (below); finished as a committed zero-critical-error property plus a narrow production graduation |
| The six safety and quality predictions | Committed at registration | Never moved — scored exactly as registered |
The auto-accept prediction is the protocol’s worked example, because it was the one the room kept inviting RCTK to promote: five invitations, five holds.
| Hold | Moment | The evidence in hand | Why it stayed held |
|---|---|---|---|
| 1 | The first gate | The assessment census: 26% of the tabular questions auto-accepted at 100% precision and zero critical errors — model-free, but small and replica-bound | Preliminary evidence earns a stretch registration at ≥25%, not a commitment |
| 2 | The Phase-2 kickoff | The clean duplication read | The evidence that had arrived gated accuracy, which was promoted; auto-accept’s dependency, scanned-table ingestion fidelity, was still a week from being measured |
| 3 | The Week-1 check | The fidelity check passed its defined zero-confident-wrong bar, by abstaining on degraded scans | Passing the safety bar cost coverage on the scanned stock, so the volume number was not yet earned; time savings was promoted instead, on its own arrived evidence (the ~63% search share) |
| 4 | The mid-pilot review | The 95.0% peak headline, and the vision-model recovery mechanism demonstrated on synthetic degradation | The prediction was split out loud: the zero-critical-error property committable now, the coverage number still gated on the scanned stock — and promoting a held number on the strength of an unrelated win is how tiers stop meaning anything |
| 5 | The second gate | ~30% of the census and 6.7% of answerable under the router, zero critical errors everywhere measured | The evidence path was approved instead of the claim: four weeks of production verification mode, with graduation a compliance decision on per-category evidence at or after the third gate |
The resolution: graduated at the third gate for exactly one category on the four-week zero-critical-error record; then ~1,100 live auto-accepts at zero critical errors in the first month (§9). The prediction finished as the protocol intends: the property committed early and kept, the volume earned late and granted narrowly.
The effect is gates without surprises: every number a gate scores was set earlier; every promotion happened between gates, on evidence, in writing; the one metric that went at-risk reached an analysis with options before the gate met. And each hold along the way is what made the committed numbers believable when they arrived.
Appendix B — Deployed Stack Reference Card
The configuration as accepted at the third gate and operated through the first support cycle.
| Layer | Deployed configuration |
|---|---|
| Generator | 14B-parameter open-weights LLM, 4-bit quantized, 16K context; no adapter; citation-first format and the compliance footer are rendered deterministically (§5.3) |
| Embedding | 0.6B-parameter embedding model, dense, 1024-dim (the 6.7×-larger alternative re-confirmed null, §5.1) |
| Retrieval | Two-stage structured: resolve (employer, plan, year, benefit line) by metadata precedence to the source-of-record document, then descriptor-rank that document’s tables and deliver the top two whole; hybrid dense + BM25 with cross-encoder rerank on the prose path; every retrieval filtered against the session permission snapshot |
| Answer construction | Deterministic typed-extraction spine — select the cell, read it verbatim in code, abstain on any ambiguity (strict type/form gate); generative path for prose/synthesis; every surfaced answer checked against its citation by the NLI entailment verifier before it surfaces |
| Router | Descriptor-cosine, tuned for recall; the spine, not the router, is the safety gate (§5.6) |
| Ingestion | Table-aware, document-type-specific chunking with descriptor tagging; webhook-driven updates, nightly reconciliation, weekly sampled re-embed; deletion tombstones; vision-language table reader (8B-parameter, ~17.5 GB) loaded on demand during reindex windows |
| Serving | Eight containers on one GPU, co-resident at a roughly 93% VRAM capacity; warm-standby second host; audit store on a separate internal-only VM |
| Integrations | Enterprise chat platform (single sign-on; messaging extension, threaded bot, feedback cards); document-management system (four in-scope libraries under one least-privilege identity); internal wiki (one SOP space); no inbound perimeter listener; no external LLM API on any code path |
| Audit | Searchable store (PII pre-scrubbed) at 7-year retention; redacted content log at 2-year; encrypted full-content log under dual-control decryption; automated nightly retention enforcement |
| Monitoring | 15 metrics, 3 role-scoped dashboards, 9 alerts (§7.4); 30-minute weekly quality review walking every flagged answer |
| Change management | CI/CD with staging on the standby host; shadow → canary (10%) → full promotion, two named approvers on every production promotion; rollback as a single feature-flag change; a base-model change triggers a full re-qualification cycle against the expanded blind set |
| Credentials | All secrets in the KMS, injected at runtime — none on disk, none in source control; scheduled rotation per credential (180-day and 90-day cadences); dual control on the audit-log encryption key |
| Failure posture | Integrity-verified model load; ingestion pauses on an upstream outage while queries serve from the consistent index; a bot-channel outage degrades to the manual document-search workflow (the assistant is never a critical-path dependency); a cache-layer outage degrades latency, not availability |
| Operating characteristic | Envelope (measured basis) |
|---|---|
| Answerable accuracy | 94.8% deployed (95.0% at the peak validated build); 94.7% on the first-month audited sample |
| Automated faithfulness | 95.5% deployed; the auto-accept path 100% by construction |
| Hallucination | 1.7% against the ≤2% production bar; 0.0% on the auto-accept path |
| Auto-accept | Graduated single-cell benefit lookups; ~30% of the tabular slice; zero critical errors standing, ~1,100 accepts in month one |
| Latency | Production p50 3.6 s (month one: ~3.1 s) against ≤4 s; p95 9.1 s (month one: ~8.4 s) against ≤10 s |
| Throughput | ~2,200 queries/hour measured single-card ceiling; observed seasonal-ramp peak ~118/hour |
| Availability | ≥99% business-hours committed; 99.7% measured on the pre-acceptance 30-day window |
Disclosure: This study report is published in anonymized form; identifying details have been generalized, and the underlying engagement artifacts remain internal. The benchmark results are measurements from controlled tests on a synthetic, production-faithful corpus; operational figures are reported as part of the anonymized engagement account. Nothing in this report is a guarantee of performance in other environments.
© 2026 RCTK. All rights reserved. This study report may not be reproduced or distributed without prior written permission.